Humidity profiles and Arctic Mixed-phase clouds as seen by Airborne W- and G-band radars
07. – 22.02.2024, Kiruna, Sweden
General information
The overarching objective of HAMAG is to test the University of Cologne’s novel G-band radar GRaWAC: G-band Radar for Water vapor and Arctic Clouds aboard AWI’s Polar 6 (C-GHGF) aircraft. GRaWAC will be embedded in a suite of remote sensing instruments (microwave radiometer, lidar, W-band radar) accompanied by dropped atmospheric soundings.
We will take off from Kiruna in Sweden and target mixed-phase clouds over various surfaces (ocean, sea ice in different stages) over the Gulf of Bothnian or along the Atlantic Norwegian coast depending on weather and ice conditions.
And who is we? Enthusiastic cloud scientists from the AWARES group from the Institute for Geophysics and Meteorology at University of Cologne with great support of AWI’s polar aircraft crew.
In the Atacama Project second phase (2021 to 2024), the A1 group focused on moisture variability and transport into the Namib and Atacama. A comparison between these two deserts allows us to understand the role of the topography in the marked observed differences in moisture, cloud, and rainfall. As the current Namib´s topography resembles the Atacama Desert before the uplift of the Andes, this study also allowed us to understand the slow aridification process that led to extended hyperaridity in the Atacama.
For this purpose, we produced a climatological comparison of water vapor interannual variability and seasonal cycle, including the role of clouds, using state-of-the-art reanalysis ERA5 validated with surface observations.
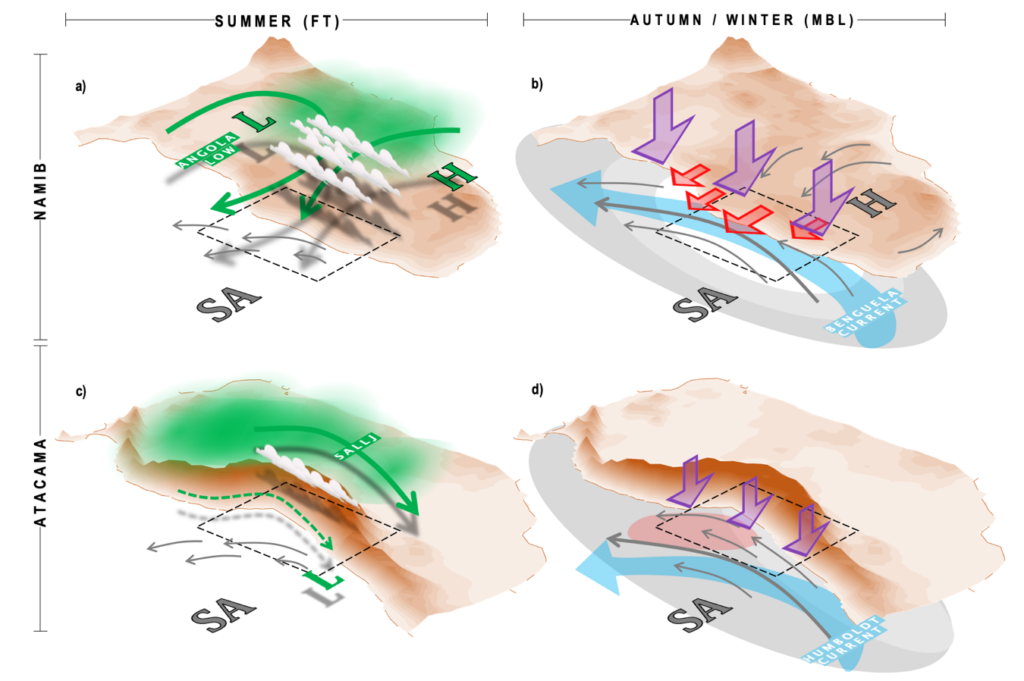
We found several differences in the atmospheric circulation triggered by the difference in topography. For example, between January and July, the circulation over southern Africa leads to persistent airmass transport from the continent’s interior to the coast. This produces two significant effects: in summer, the easterly winds increase moisture in the free-troposphere, accompanied by clouds and rainfall (Fig. 1a). In autumn and winter, the easterlies are shallower, disrupting the coastal marine boundary layer (MBL), reducing the low clouds near Namib´s coast and inducing frequent clear-sky conditions (Fig. 1b).
Figure 1. Schematic figure of the main features associated with changes in water vapor and clouds for summer (DJF) in the free-troposphere (a,c) and autumn (MAM) and winter (JJA) for the boundary layer (b,d). In the left panels: the circulation pattern at 850–750 hPa in green arrows. Green thick and thin-dashed arrows represent strong and weak water vapor transport, respectively. We included the position of the main low (L) and high (H) pressure systems, as well as the South American Low-Level Jet (SALLJ). In the right panels, boundary layer winds are plotted with gray arrows. The stratocumulus cover is represented with gray shades, with darker tones indicating more clouds and white less clouds. The Benguela and Humboldt currents are shown by clear blue arrows and warmer SSTs in clear red. Warmer air in the upper MBL/lower FT is represented by red arrows and the subsidence intensity in purple arrow. We included the position of the Subtropical Anticyclones (SA) and the continental high-pressure systems (H) [Vicencio et al., 2023]
In the Atacama, the Andes block almost any exchange of air mass between the Pacific Ocean and the continent’s interior. In summer, moisture from the Amazonas is directed southeast of the Andes, leading to a drier free-troposphere in the Atacama compared to the Namib (Fig. 1c). The absence of the easterlies on the Atacama’s coast maintains year-round a well-developed MBL, with a higher proportion of low clouds than Namib despite the weaker low-level stability and warmer SST (Fig. 1d).
The impact of topography on rainfall can also be interpreted by comparing both desert’s current climates. The most rainfall in Namib is observed between summer and autumn due to the effect of the easterly winds. The Atacama lacks this feature, reducing the wet period only to winter. Therefore, it is highly likely that the Atacama observed a similar rainfall pattern as in the Namib nowadays before the uplift of the Andes around 20 Million years ago. Continued uplift of the cordillera likely intensified the aridification of the desert’s interior by blocking moisture transport from the interior of South America, leading to the extreme drier conditions observed nowadays on the coast and central depression, where the annual rainfall rates ranges barely between 0.25 and 5 mm.
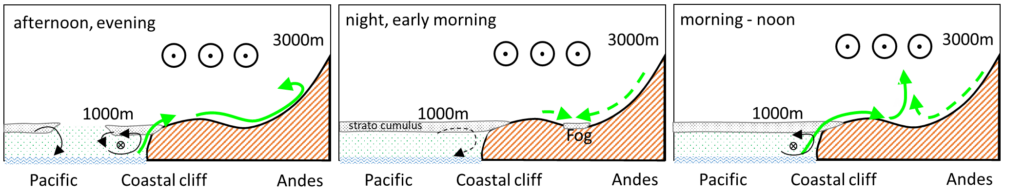
Despite the extreme hyperaridity in the Atacama, moisture finds its way to the core of the desert. Using surface-based weather stations and Large Eddy simulations with the ICON-LEM model for a typical winter day, we found that moisture from the MBL crosses the coastal mountains through certain valleys (Fig. 2). Most of this transport occurs in the afternoon-evening and reaches the slopes of the Andes but not further. This moist air remains in valleys and basins during the night, where nighttime cooling eventually leads to fog formation. At the onset of the circulation in the morning and noon hours, convergence at the surface leads to the injection of moist air in the atmosphere above the surface boundary layer. From here, it is transported further south by the mid-troposphere circulation. Reanalysis data suggest that this feature is relatively common in austral winter.
Figure 2: Schematic of the diurnal circulation. Green arrows indicate water vapor transport from the maritime boundary layer into the desert. The weaker nighttime downslope flow is marked with dashed lines. Circles with dots at 3km height indicate a northerly, moist flow transporting moisture to the south. [Figure created by Dr. Jan Schween and modified from Schween et. al 2020]
Additionally, we found that moisture also finds its way in summer. This time, thanks to a weak but climatological moisture transport structure (Fig. 1c) in the lower free troposphere offshore southern Perú and northern Chile, bringing the humidity from the tropical eastern Pacific to the desert. We named this mechanism as moist northerlies (Vicencio et al., in review). Once the humidity reaches the Atacama´s coast, it is transported inland by the Rutllant cell. This pattern sometimes leads to extreme precipitation events across the Atacama and precordillera. In recent decades, the number of summer rainfall episodes linked with this mechanism has increased, reaching a peak in 2020.
The key mechanism for this moisture intrusion into the desert is the southward shift of the subtropical anticyclone, which is associated with the expansion of the Hadley cell due to human-induced greenhouse gas emissions. Therefore, it is highly likely to continue observing similar rainfall events in the next decades over the Atacama, increasing moisture availability via transport, rainfall and clouds.
Note: This post was originally written and edited by Jose Vicencio and Jan Schween for the Atacama Project Website.
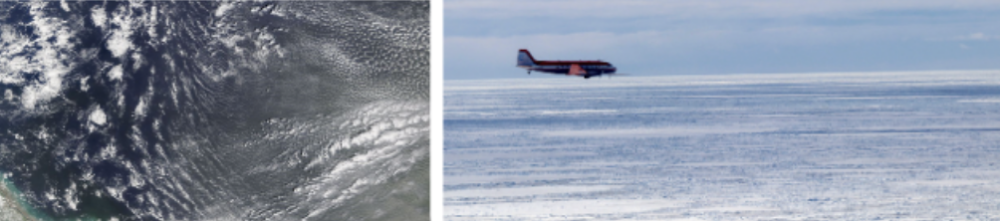
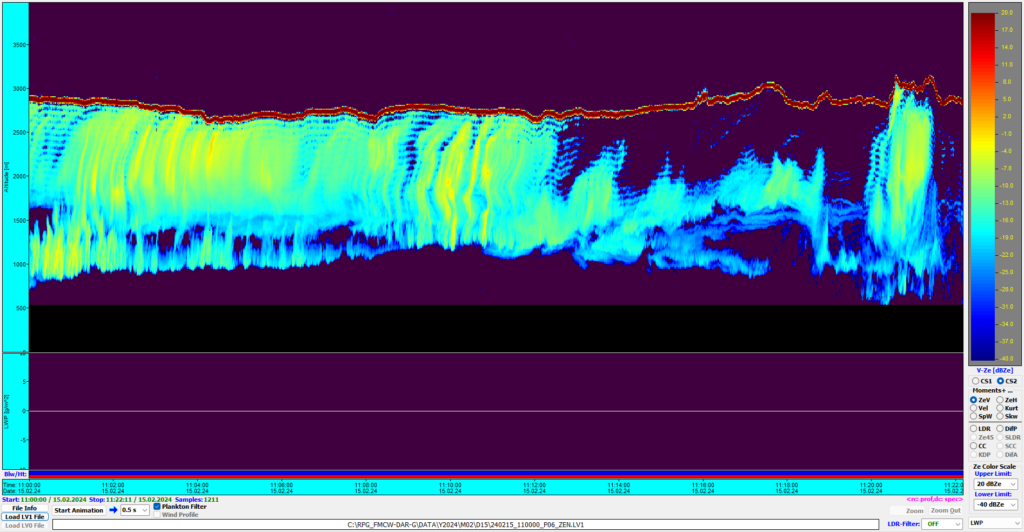
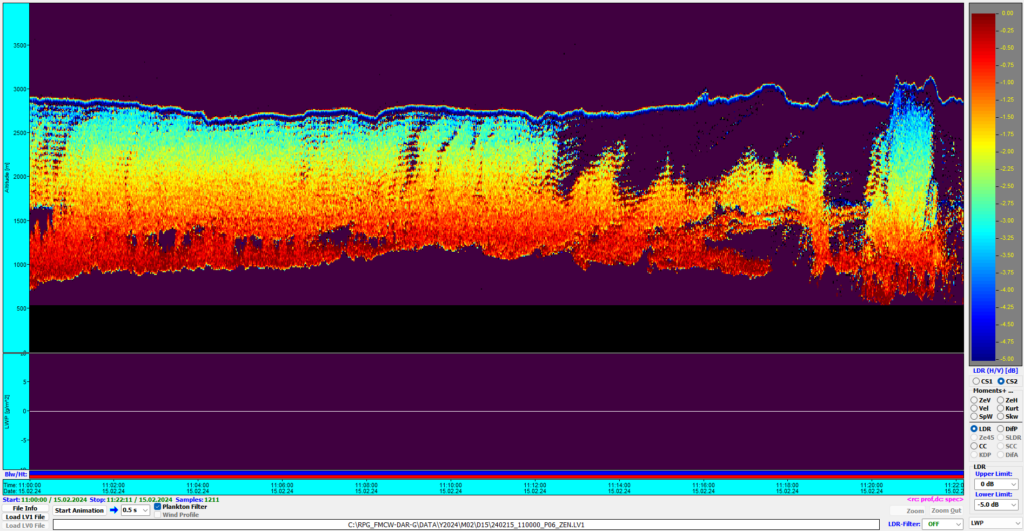
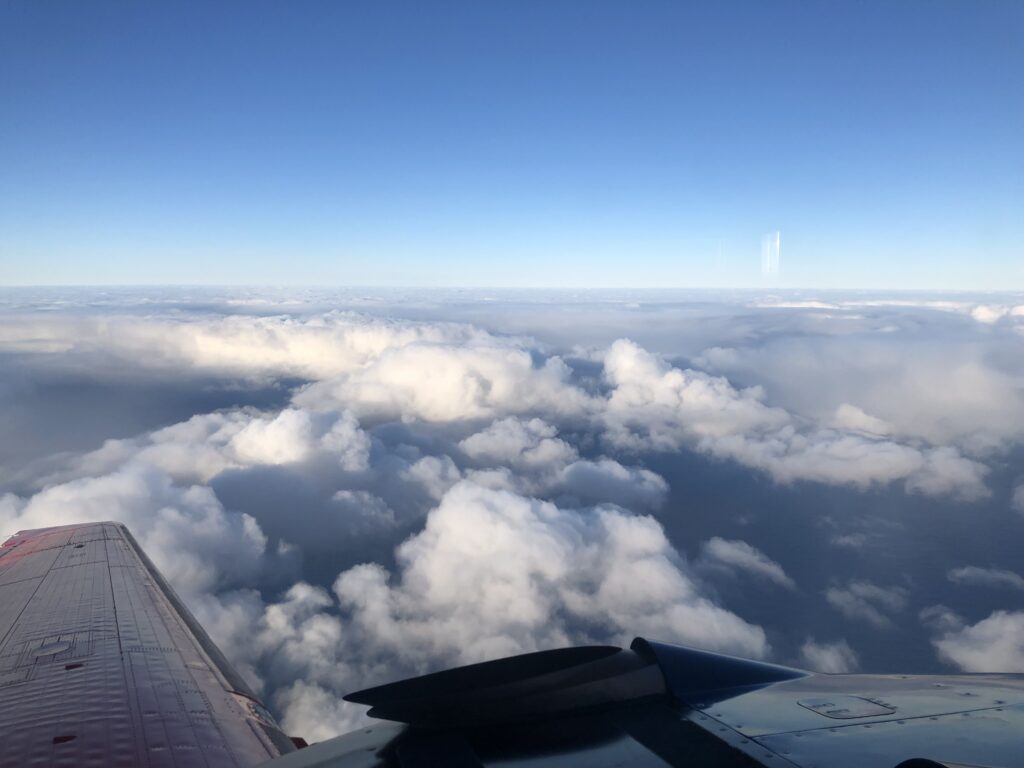
Today’s research flight was a repetition of RF01 cruising down the Gulf of Bothnia from its northern end down South till we reach the cloud decks that usually form over the open ocean. This year’s ice extension is quite large and it takes us more than one hour to get there. Since the models did not forecast any clouds over the ice in the bay, we planned to use this section for sea ice emissivity measurements. But in contrast to the forecast we could see low clouds covering the ice surface, giving us the chance to see how the new radar performs on these.
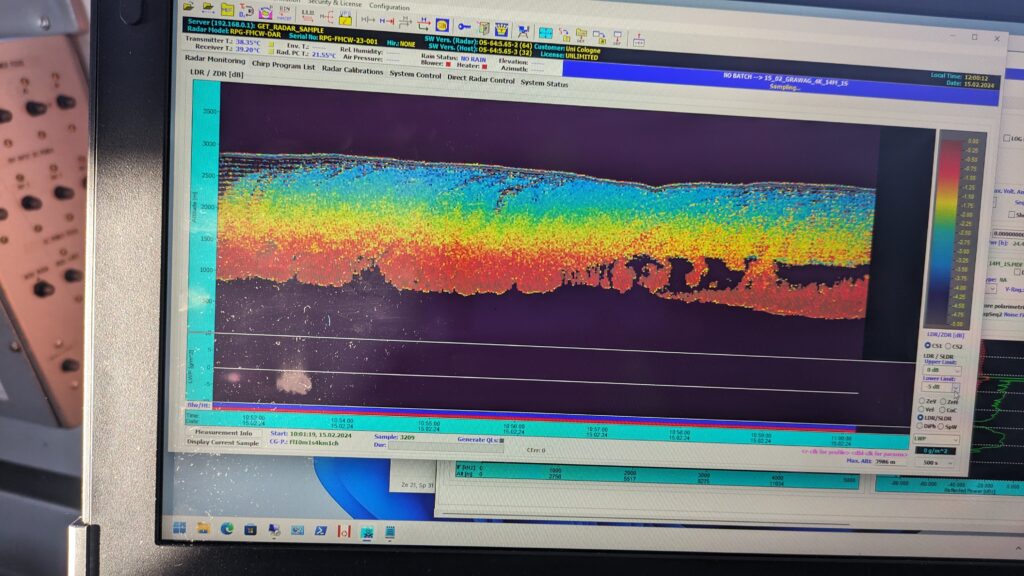
Very thin clouds lying on the ground could not be seen, neither by the G- nor by the W-band radar. But very interestingly, the surface return and the patterns of ghost images changed as soon as clouds were in the beam width.
Cruising along the bay we reached thicker clouds organized in several layers. Between the layers, seeder-feeder effects could be seen in the radars as well as DAR signals of up to 7 dB. All in all another very successful flight with a lot of knowledge on our new GRaWAC radar.
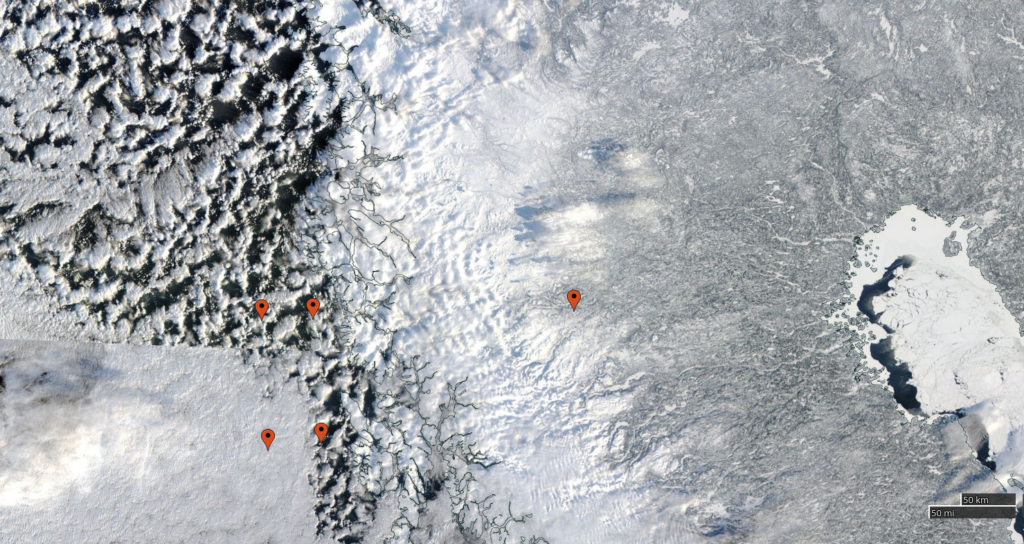
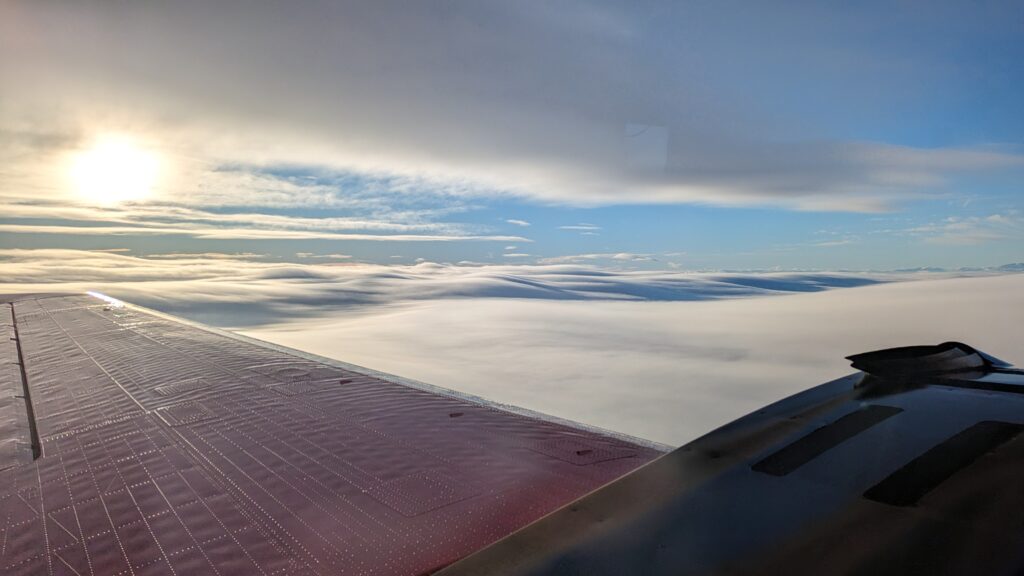
We flew over to the Norwegian coast off Tromso to sample beautiful open and closed cell convection (see satellite image) resulting from a cold air outbreak near Svalbard. Crisp and clear flight conditions in Kiruna made take-off and landing smooth, and after passing some textbook lenticularis clouds over the mountain range, we arrived at the very cloudy survey square over the ocean.
Terra MODIS image retrieved from worldview.earthdata.nasa.gov; Kiruna is the waypoint on the right, survey square is marked off the Norwegian coastline.
open cell structure closed-cell alike structure
With our flight altitude of 10,000ft (about 3.3km), it was harder to distinguish the cells’ structure, but circular, open areas were easy to see in our instruments and with our eyes. Open cells, seen in the upper left corner of the sat image, are circular areas of clear air with clouds forming along the edges: cold air sinks down in the clear air, diverges at surface, and rises at the edges, leading to ring-shaped cloud formation. Closed cells (bottom left) work the other way around: warm, moist air rises in the cell’s center, while cold air sinks around the cell’s edge. The decks here additionally get influenced by air hitting the coast line, leading to accumulation of clouds. Both cell types produce different amount of rain which we could very well observe with both our radars!
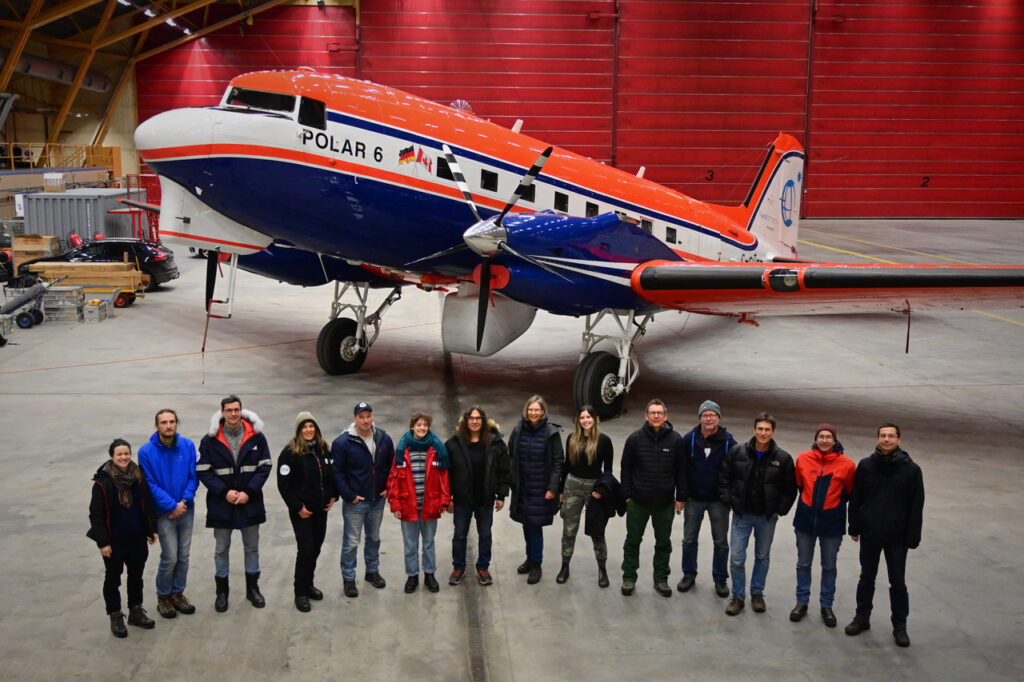
Before some of us left the team, we took the chance to take a picture of the HAMAG crew in front of our reliable research platform Polar 6 in Arena Arctica. In the middle underneath the fuselage, you can see the belly pod carrying our two radars, GRaWAC and MiRAC.
Outlook for tomorrow. For the first time, we will try a survey on the Norwegian coast.
It’s not a surprise, that when you are looking for clouds to measure, it is very likely that you find them as well at the airport you plan to operate from. That’s what we had to deal with today. But pilots were convinced that it was doable, we did it, and it turned out to be the day that you do not want to miss.
It has always been the plan to stay local and find a good cloud deck to test different radar settings and get the first real differential absorption signal from the two GRaWAC channels. We found suitable clouds East of Kiruan on a 100 nm North-South leg that we followed four times before being back at Kiruna after about 4.5 hours. The data we collected look beautiful and should be the ones we needed to make this campaign a full success.
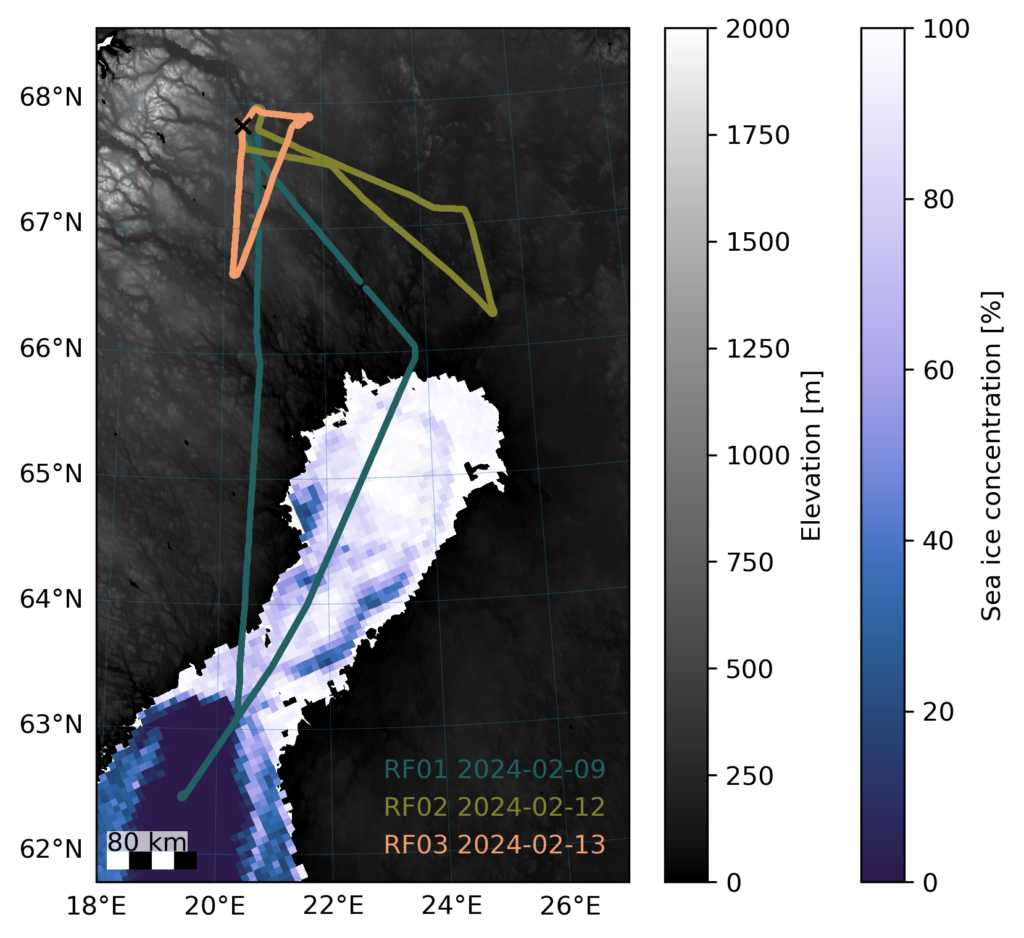
As we reach the midpoint of HAMAG, let’s reflect on the campaign thus far. Our initial three flights have covered the region south and southeast of Kiruna and over the Bothnian Bay. The map below with a digital elevation model and sea ice concentration from the University of Bremen provides an overview of our flight trajectories.
The sea ice concentration map illustrates the closed sea ice in the northern bay and the open ocean towards the south on 9 February 2024. The transect of flight RF01 on this date covered both areas of the Bothnian Bay. Meanwhile, the other two flights focused on low clouds and fog formations over land.
We will continue to update this map to include upcoming research flights.
An overview map of the HAMAG flight tracks with terrain elevation (Berry et al., 2019) and sea ice concentration (Spreen et al., 2008).
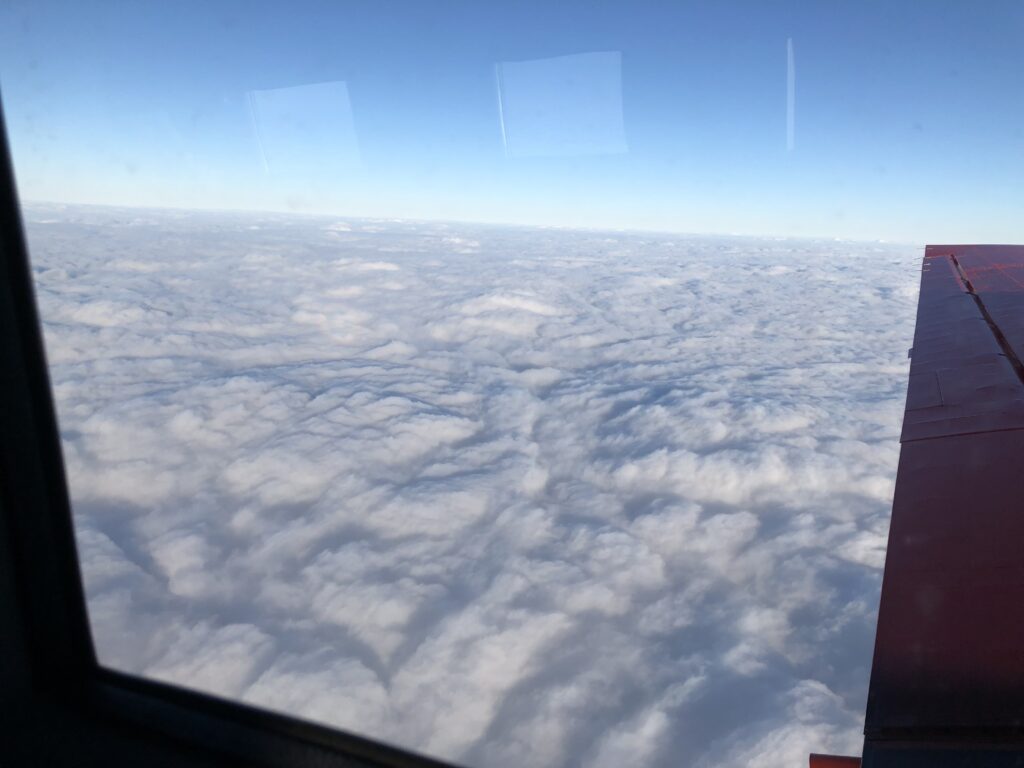
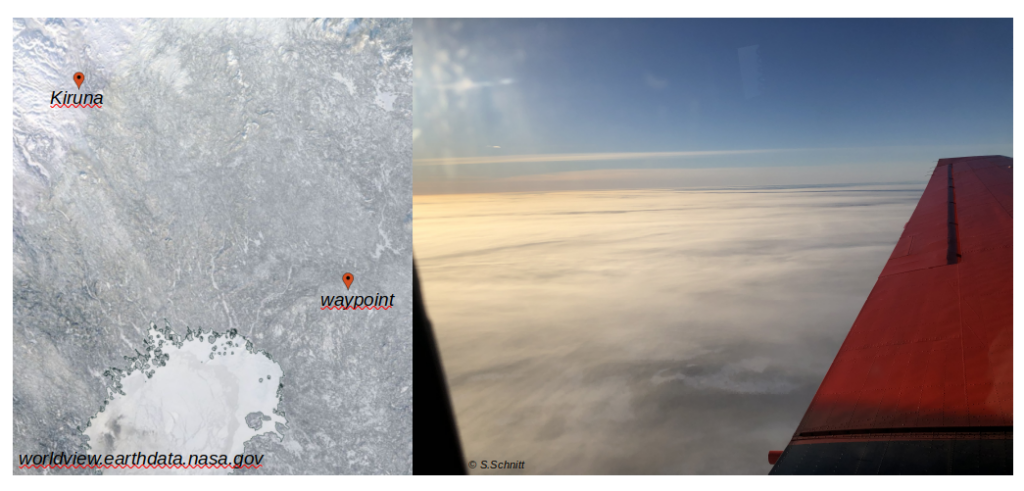
Today’s flight planning and go or no-go decision have not been easy. The overall situation has been similar to yesterday’s with haze all over Northern Sweden and Finland and the area around Kiruna airport showing a sunny sky with broken low-level clouds only, but with a forecast saying low visibility and difficult landing conditions throughout the day. After long discussions, we decided to go for a short survey, staying local to test different settings for GRaWAC to sense the low-level haze.
Up in the air, we tried different settings with the radars to see which works best with the thin haze. Although the haze was very thin and the ground was visible, both got a signal from time to time. To get an idea of temperature and humidity stratification, two dropsondes have been launched.
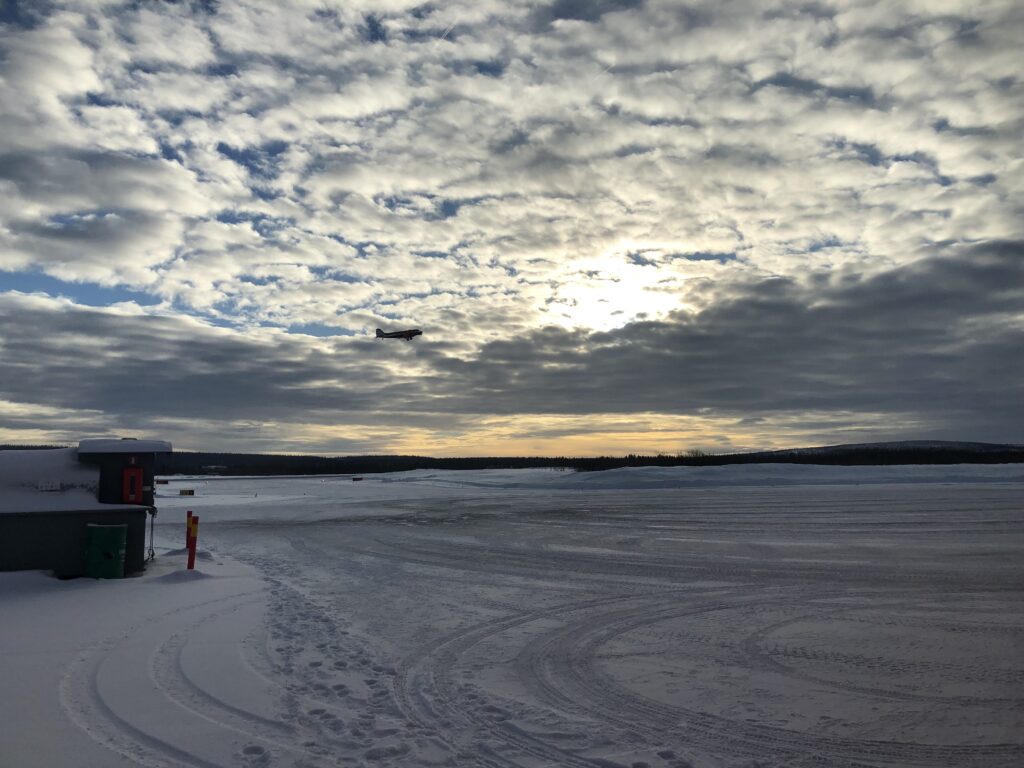
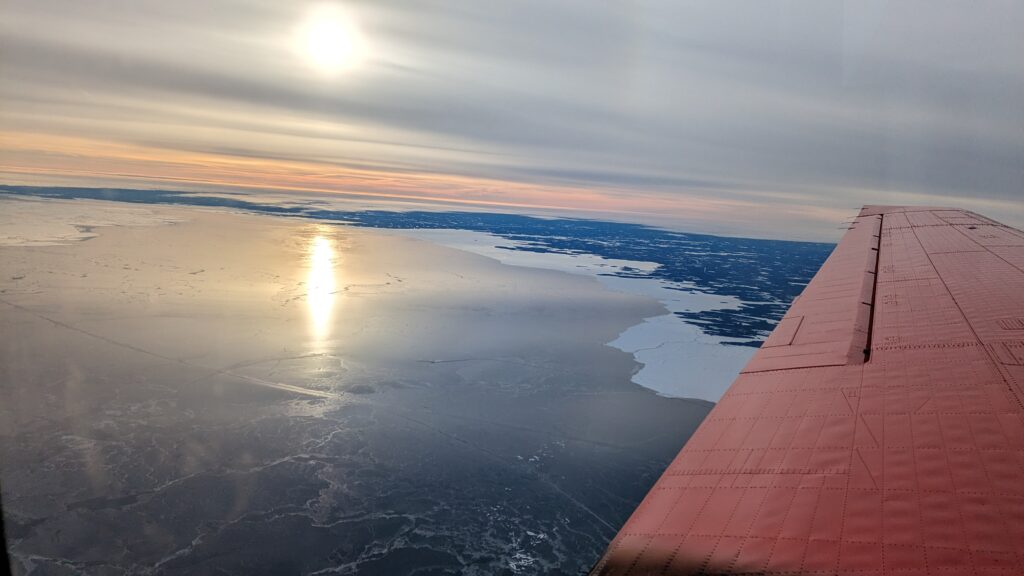
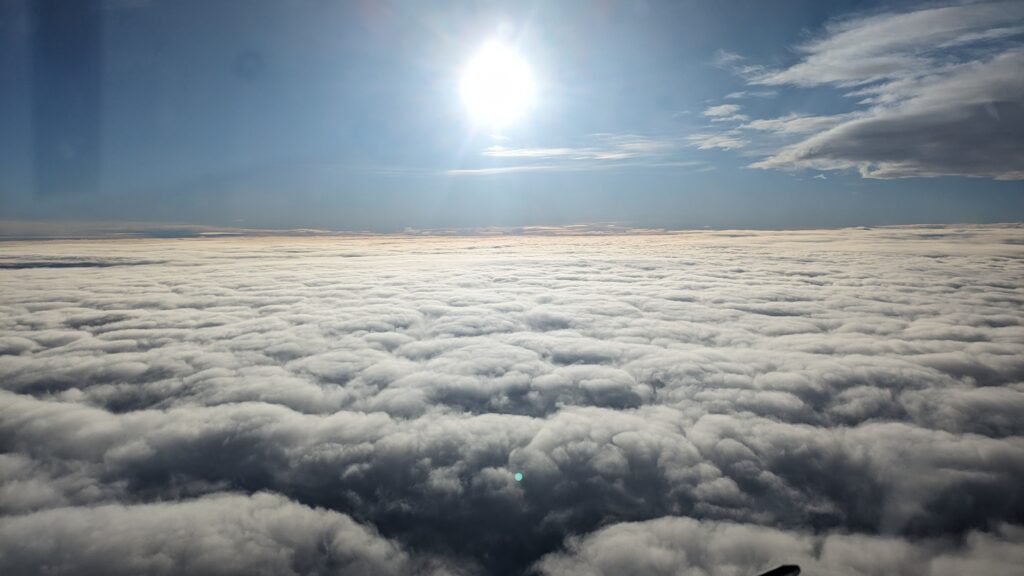
High pressure conditions gave us wonderfully sunny and crisp winter weather this weekend, but also made all the clouds disappear! We decided to target forecasted haze conditions towards Finland around Sodankylä to test our new radar GRaWAC’s sensitivity limits. Good news: higher sensitivity to detect thin layers of cloud and haze, even close to the surface, compared to our existing cloud radar MiRAC! With today’s tests, we are optimistic that we will be able to detect Arctic haze over sea ice conditions around Svalbard, our survey area for upcoming campaigns where low-level haze is crucial for radiation characteristics. The fog today was mysterious – it looked like thicker clouds from far away, but once we reached the decks, conditions were such as seen below in the photo: we could see through it easily down to the ground. Our radar detected a 30m thickness.
haze conditions as seen between Kiruna and the waypoint which we headed to