In the Atacama Project second phase (2021 to 2024), the A1 group focused on moisture variability and transport into the Namib and Atacama. A comparison between these two deserts allows us to understand the role of the topography in the marked observed differences in moisture, cloud, and rainfall. As the current Namib´s topography resembles the Atacama Desert before the uplift of the Andes, this study also allowed us to understand the slow aridification process that led to extended hyperaridity in the Atacama.
For this purpose, we produced a climatological comparison of water vapor interannual variability and seasonal cycle, including the role of clouds, using state-of-the-art reanalysis ERA5 validated with surface observations.
We found several differences in the atmospheric circulation triggered by the difference in topography. For example, between January and July, the circulation over southern Africa leads to persistent airmass transport from the continent’s interior to the coast. This produces two significant effects: in summer, the easterly winds increase moisture in the free-troposphere, accompanied by clouds and rainfall (Fig. 1a). In autumn and winter, the easterlies are shallower, disrupting the coastal marine boundary layer (MBL), reducing the low clouds near Namib´s coast and inducing frequent clear-sky conditions (Fig. 1b).
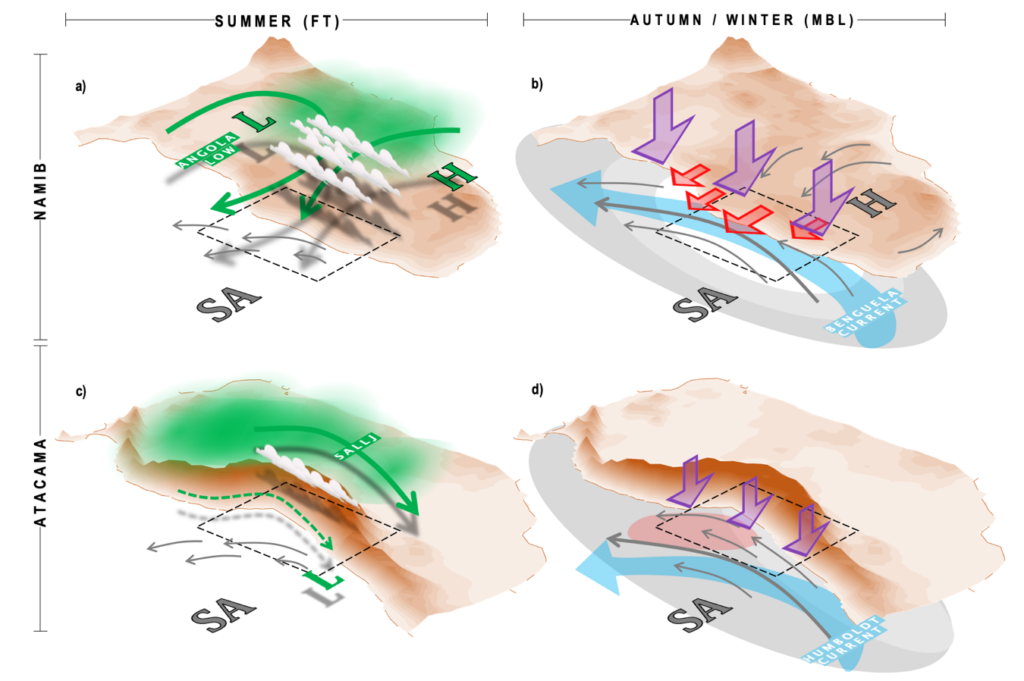
Figure 1. Schematic figure of the main features associated with changes in water vapor and clouds for summer (DJF) in the free-troposphere (a,c) and autumn (MAM) and winter (JJA) for the boundary layer (b,d). In the left panels: the circulation pattern at 850–750 hPa in green arrows. Green thick and thin-dashed arrows represent strong and weak water vapor transport, respectively. We included the position of the main low (L) and high (H) pressure systems, as well as the South American Low-Level Jet (SALLJ). In the right panels, boundary layer winds are plotted with gray arrows. The stratocumulus cover is represented with gray shades, with darker tones indicating more clouds and white less clouds. The Benguela and Humboldt currents are shown by clear blue arrows and warmer SSTs in clear red. Warmer air in the upper MBL/lower FT is represented by red arrows and the subsidence intensity in purple arrow. We included the position of the Subtropical Anticyclones (SA) and the continental high-pressure systems (H) [Vicencio et al., 2023]
In the Atacama, the Andes block almost any exchange of air mass between the Pacific Ocean and the continent’s interior. In summer, moisture from the Amazonas is directed southeast of the Andes, leading to a drier free-troposphere in the Atacama compared to the Namib (Fig. 1c). The absence of the easterlies on the Atacama’s coast maintains year-round a well-developed MBL, with a higher proportion of low clouds than Namib despite the weaker low-level stability and warmer SST (Fig. 1d).
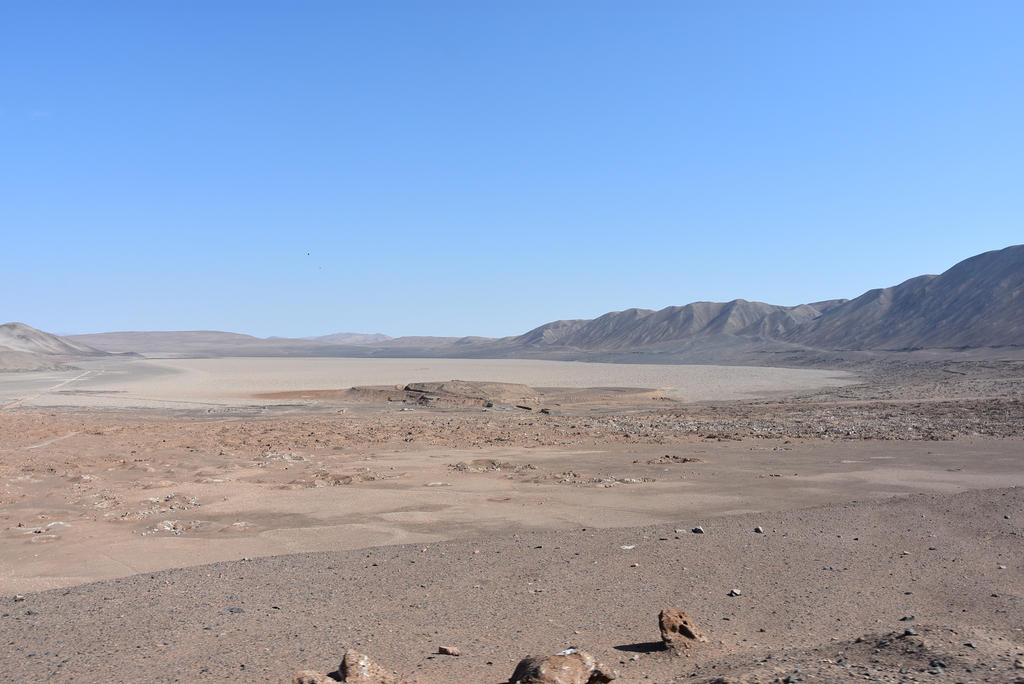
The impact of topography on rainfall can also be interpreted by comparing both desert’s current climates. The most rainfall in Namib is observed between summer and autumn due to the effect of the easterly winds. The Atacama lacks this feature, reducing the wet period only to winter. Therefore, it is highly likely that the Atacama observed a similar rainfall pattern as in the Namib nowadays before the uplift of the Andes around 20 Million years ago. Continued uplift of the cordillera likely intensified the aridification of the desert’s interior by blocking moisture transport from the interior of South America, leading to the extreme drier conditions observed nowadays on the coast and central depression, where the annual rainfall rates ranges barely between 0.25 and 5 mm.
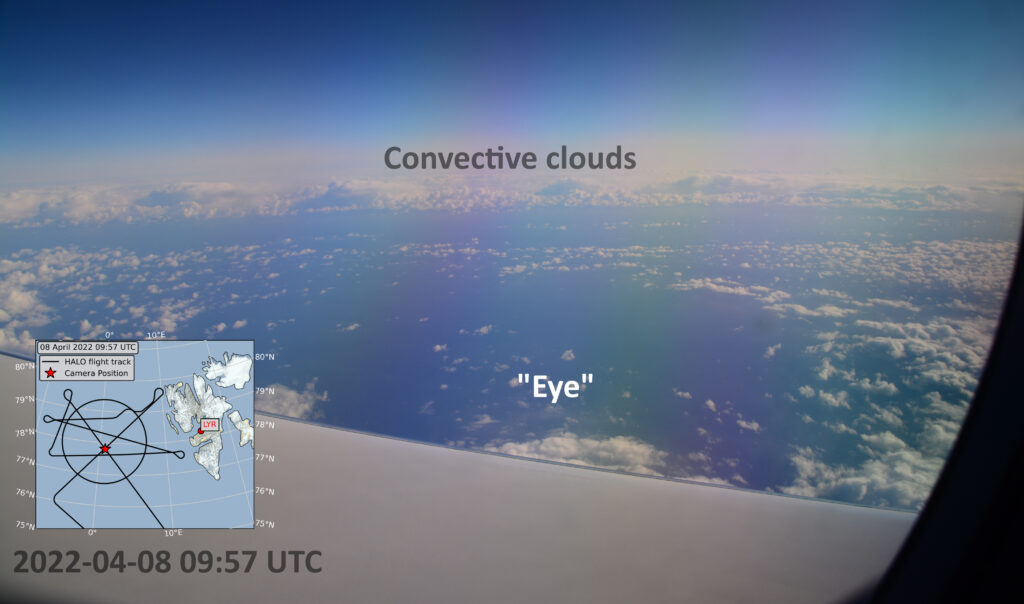
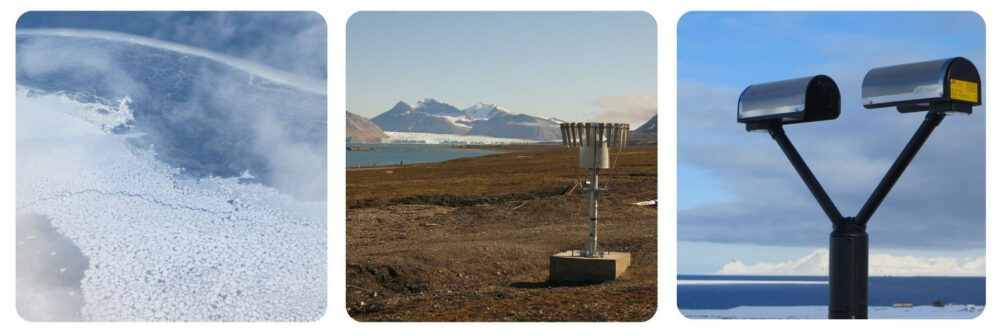
Despite the extreme hyperaridity in the Atacama, moisture finds its way to the core of the desert. Using surface-based weather stations and Large Eddy simulations with the ICON-LEM model for a typical winter day, we found that moisture from the MBL crosses the coastal mountains through certain valleys (Fig. 2). Most of this transport occurs in the afternoon-evening and reaches the slopes of the Andes but not further. This moist air remains in valleys and basins during the night, where nighttime cooling eventually leads to fog formation. At the onset of the circulation in the morning and noon hours, convergence at the surface leads to the injection of moist air in the atmosphere above the surface boundary layer. From here, it is transported further south by the mid-troposphere circulation. Reanalysis data suggest that this feature is relatively common in austral winter.
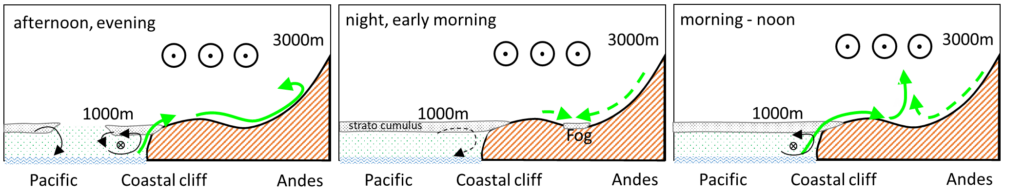
Figure 2: Schematic of the diurnal circulation. Green arrows indicate water vapor transport from the maritime boundary layer into the desert. The weaker nighttime downslope flow is marked with dashed lines. Circles with dots at 3km height indicate a northerly, moist flow transporting moisture to the south. [Figure created by Dr. Jan Schween and modified from Schween et. al 2020]
Additionally, we found that moisture also finds its way in summer. This time, thanks to a weak but climatological moisture transport structure (Fig. 1c) in the lower free troposphere offshore southern Perú and northern Chile, bringing the humidity from the tropical eastern Pacific to the desert. We named this mechanism as moist northerlies (Vicencio et al., in review). Once the humidity reaches the Atacama´s coast, it is transported inland by the Rutllant cell. This pattern sometimes leads to extreme precipitation events across the Atacama and precordillera. In recent decades, the number of summer rainfall episodes linked with this mechanism has increased, reaching a peak in 2020.
The key mechanism for this moisture intrusion into the desert is the southward shift of the subtropical anticyclone, which is associated with the expansion of the Hadley cell due to human-induced greenhouse gas emissions. Therefore, it is highly likely to continue observing similar rainfall events in the next decades over the Atacama, increasing moisture availability via transport, rainfall and clouds.
Note: This post was originally written and edited by Jose Vicencio and Jan Schween for the Atacama Project Website.