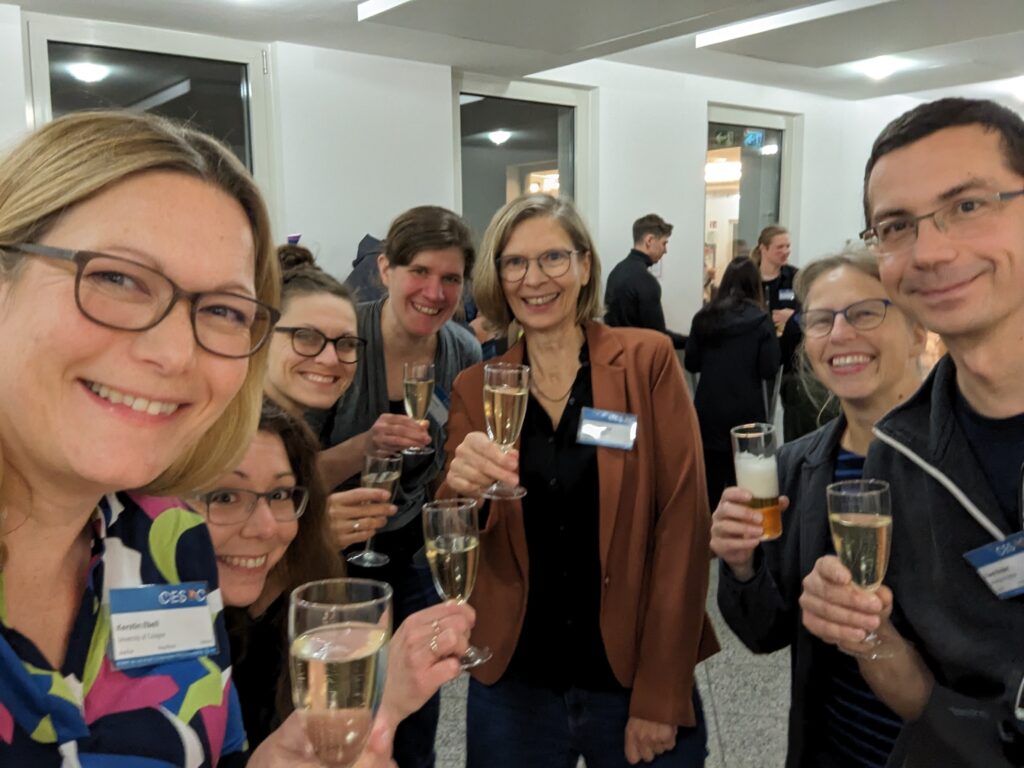
Time to celebrate! We received the great news that the CRC/TRR “Arctic Amplification(AC)³” will be funded by DFG for another 4 years (2024-2027). We are looking forward to continuing to do fascinating research in the high north!
Find below some press releases where you can read more about that:
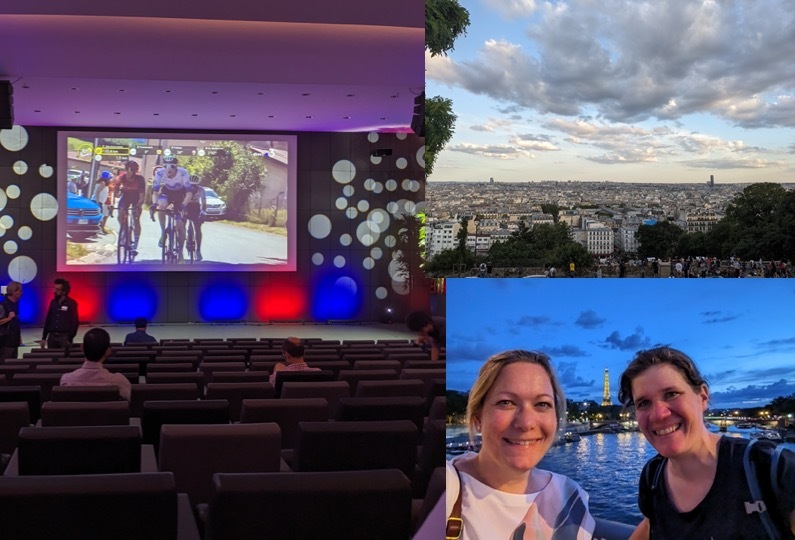
Last week, Kerstin and Vera participated in the joint CFMIP-GASS* meeting in Paris. Apart from presentations and discussions about clouds, convection, circulation, and climate sensitivity, we even participated (virtually) in the Tour de France during the lunch break!
*CFMIP: Cloud Feedback Model Intercomparison Project & GASS: Global Energy and Water Exchanges (GEWEX)’s Global Atmospheric System Studies
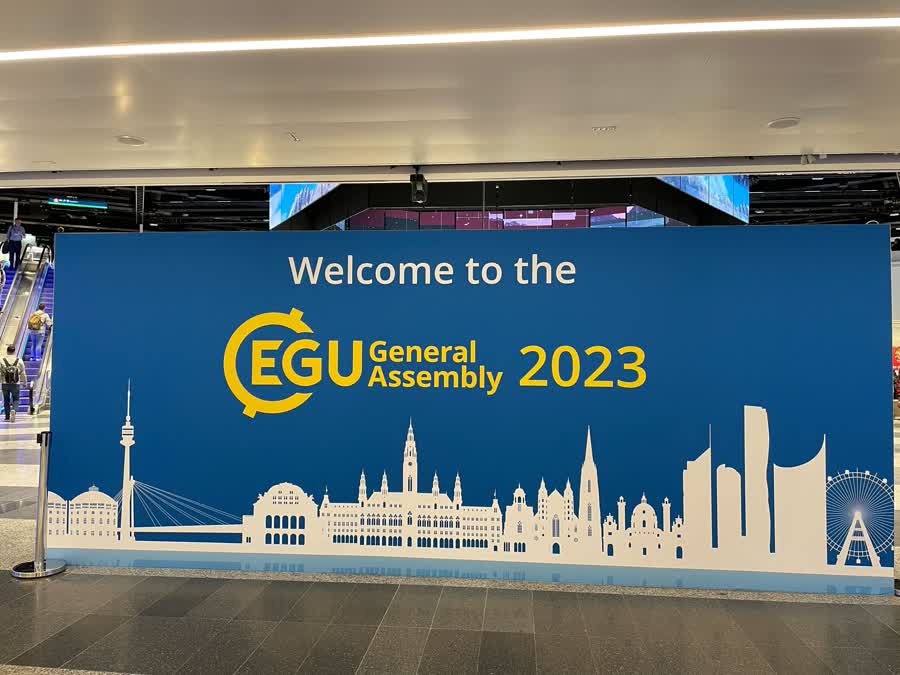
In the last week of April, our group participated in the annual EGU General Assembly organized by the European Geosciences Union in Vienna. Around 19,000 geoscientists from 107 countries gathered at the conference to present their latest results. The more than 16,000 presentations covered Atmospheric, Climate, Cryospheric Science, and many more. Furthermore, there were symposia, short courses, and networking events.
For all of us, the EGU conference provided everything for fruitful discussions about our scientific work and potential collaborations. Besides science, it allowed us to meet many new people and friends from other institutes. And finally, Vienna treated us well with Austrian specialties such as Käsespätzle and Kaiserschmarrn during lunchtime.
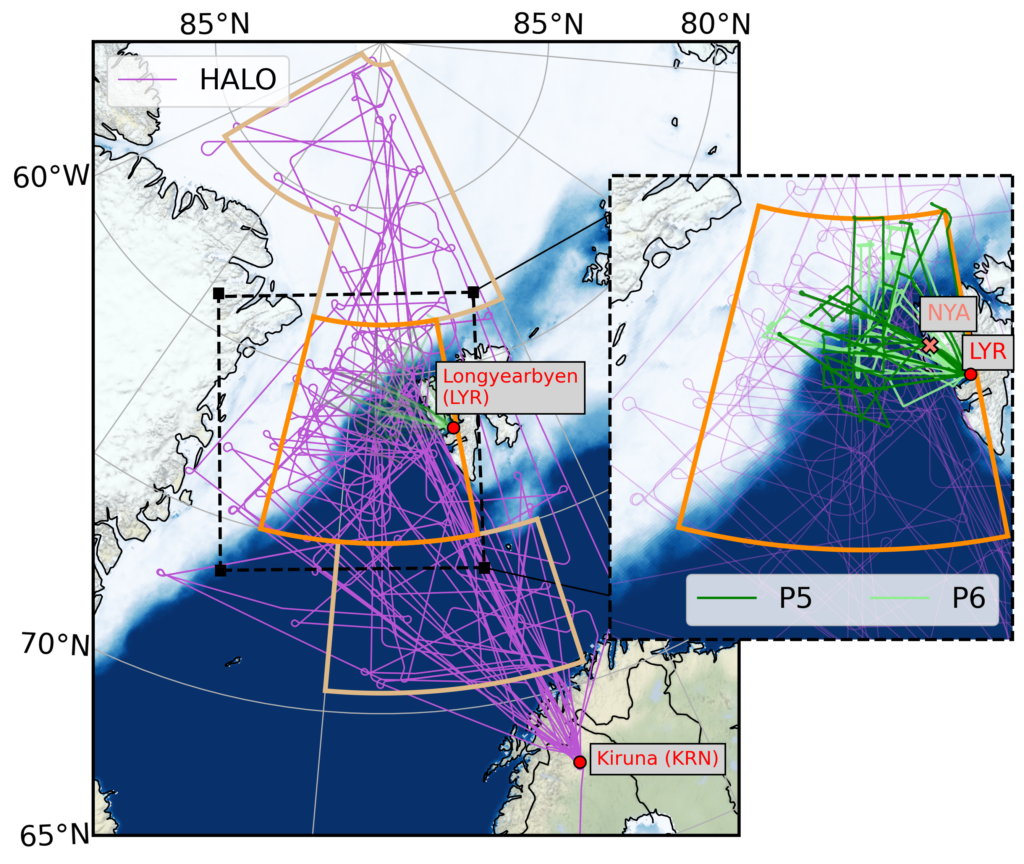
As we reported earlier in this blog, we participated in the airborne field campaign HALO-(AC)³ In March and April 2022. The goal of the campaign was to improve the understanding of the airmasses transformation when transported into or out of the Arctic. Two types of airmass transports were of particular interest: First, moist and warm air intrusions that transport high amounts of heat and moisture from the mid-latitudes into the Arctic. Second, marine cold air outbreaks that lead to the formation of cloud streets and convective cells when cold and dry air from the central Arctic is transported southwards over the relatively warm North Atlantic. In our study, we analyse the weather (and sea ice) conditions during the HALO-(AC)³ campaign.
Map of the study area of the HALO-(AC)³ campaign including the flight tracks of the research aircraft HALO, Polar 5 (P5) and Polar 6 (P6). The study area has been separated into three subregions.
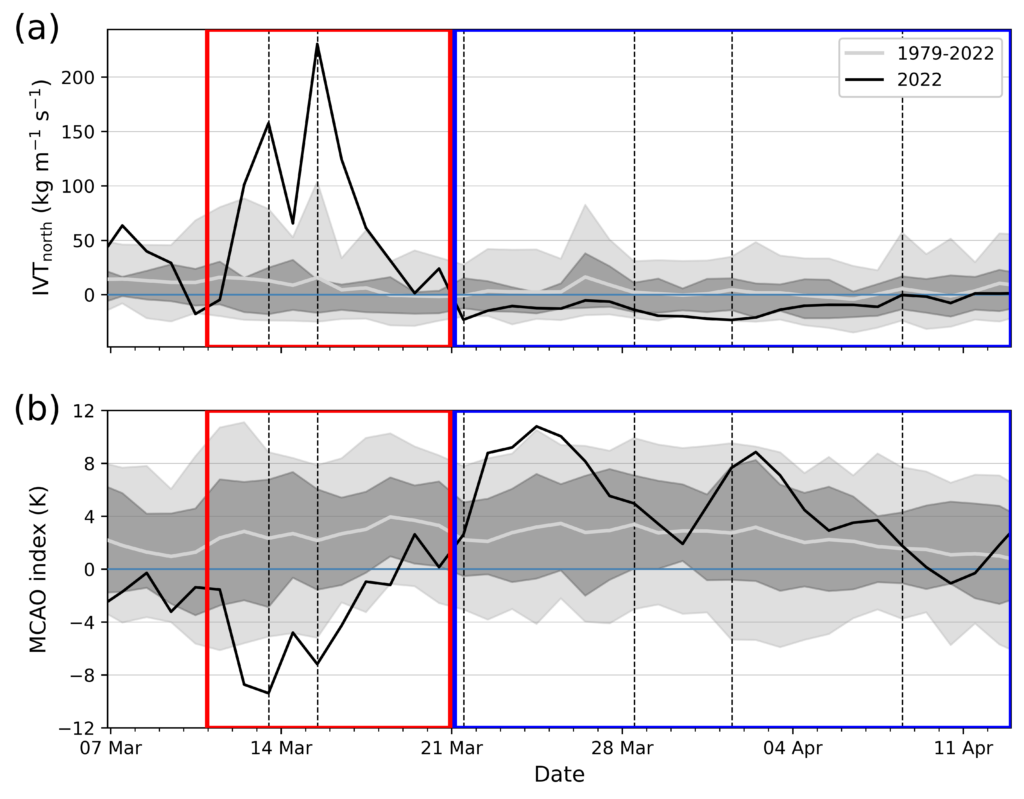
We separated the campaign into a warm and a cold period with the help of northwards humidity transport (IVT) and the so-called cold air outbreak index (MCAO index). The cold air outbreak indicates the strength of the temperature difference between the surface and the lower atmosphere. High differences suggest cold air outbreak conditions with strong interactions between the cold ocean and the atmosphere. The warm period was dominated by northward winds and warm air intrusions while the cold period featured several cold air outbreaks.
(a) Northward water vapour transport (IVTnorth) and (b) marine cold air outbreak (MCAO) index for the campaign duration in 2022 (black line). Grey shading indicates the climatology over the years 1979-2022. The red box shows the warm period, while the blue box illustrates the cold period.
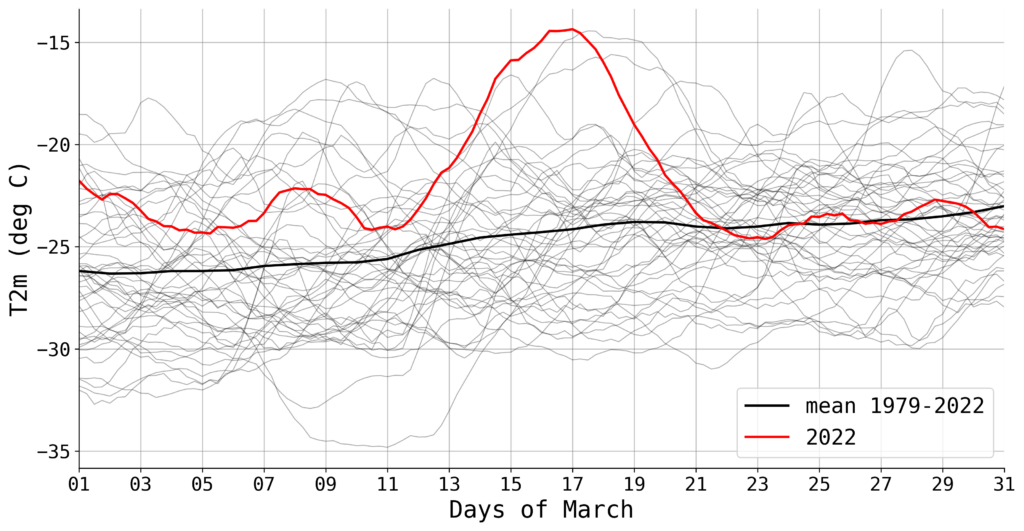
During an extremely strong warm air intrusion, record breaking near-surface temperatures occurred in the central Arctic compared to the March 1979-2022 climatology. Also at Ny-Ålesund, the weather station recorded the highest near-surface temperatures for March since the beginning of the measurements in 1975. This warm air intrusion was detected as so-called Atmospheric River, a thin but long band of extremely strong moisture transport. Over the sea ice northwest of Svalbard, record breaking rainfall rates occurred.
Average 2 m temperature in March 2022 north of 80°N (red line). Thin black lines show the temperature for each year between 1979 and 2022 and the thick black line illustrates the average over those years.
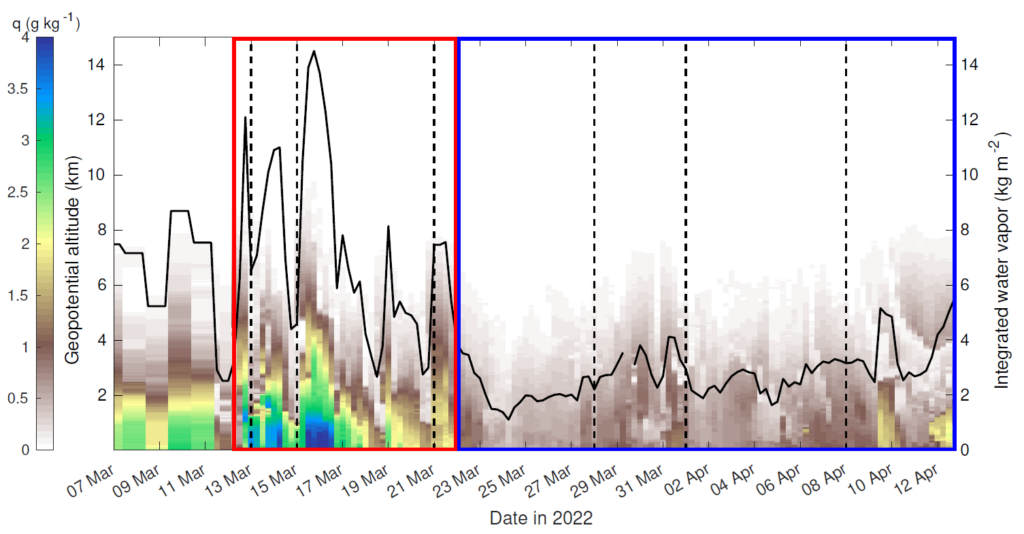
At the beginning of the cold period, a strong cold air outbreak led to an extremely dry atmosphere over Ny-Ålesund with integrated water vapour content of just 1.1 kg m-2 (24 March 2022). Less than 3 % of all radiosondes launched since 1993 recorded drier conditions.
Humidity measurements from radiosondes (weather balloons) launched at Ny-Ålesund (Svalbard) during HALO-(AC)³. The colours indicate the specific humidity (fraction of water vapour mass to total air mass) while the black line shows the total humidity content of the troposphere (lowest layer of the atmosphere).
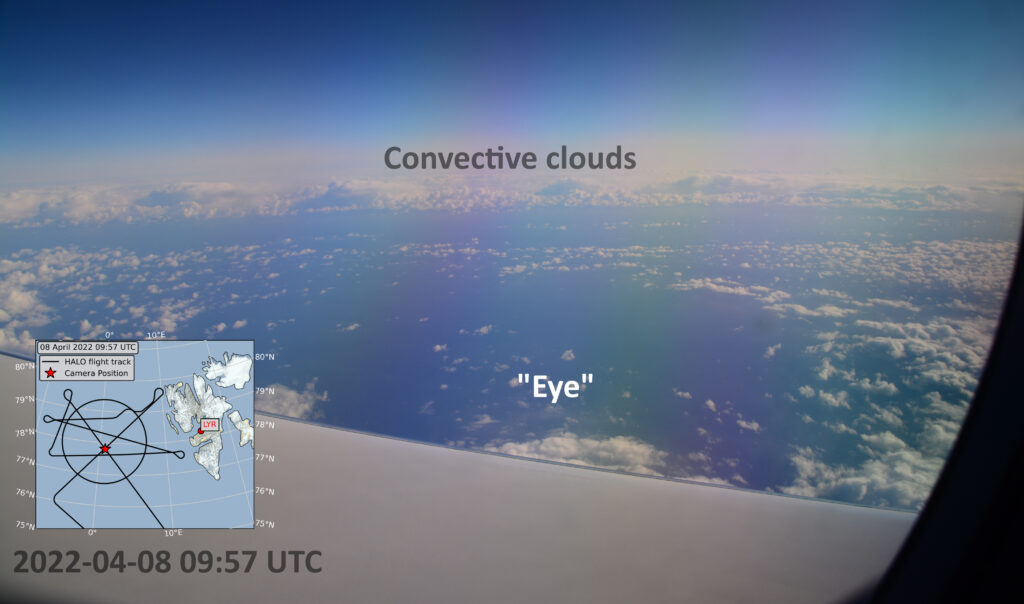
During the cold period, we also observed the Arctic version of a hurricane, a Polar Low. Polar Lows are characterised by convective (cumulus) clouds, relatively strong winds (at least gale force) and precipitation, while extending only over a few 100 kilometers. They also have a relatively cloud free centre like the eye of a hurricane. We analysed the environmental conditions for the formation of the Polar Low.
Photo taken from the research aircraft HALO during the flight to observe the Polar Low.
Luckily, the weather conditions were quite favourable to achieve the goals of the campaign because we could capture both types of airmass exchange between mid-latitudes and the Arctic. The publication has been submitted to the European Geosciences Union journal Atmospheric Chemistry and Physics.
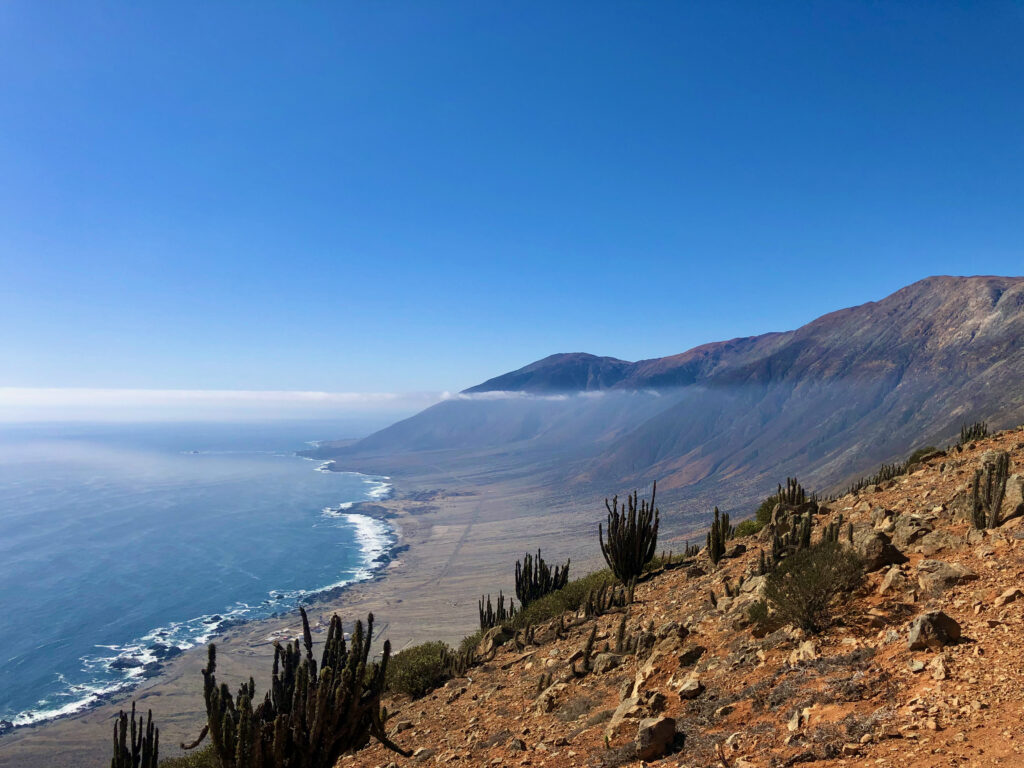
The sharp topography is just one of the characteristics of the Atacama Desert
In October 2022, a group of biologists, geologists, geographers and meteorologists travelled to the Atacama Desert in northern Chile, the driest desert in the World.
This travel is under the umbrella of a big German project called CRC-1211: Evolution at the dry limit. The aim of the project is to understand how the life and landscape evolves in this hard environment condition, as well the interaction with the geological and meteorological processes.
The Atacama Desert lies between the bast Pacific Ocean and the Andes Cordillera, featuring low atmospheric humidity, scarce precipitation and almost no clouds. However, clouds do reach the Atacama, especially at the coast, thanks to the presence of an almost semi-permanent stratocumulus deck in the southeast Pacific.
Next to the coast, the coastal cordillera (ranging between 800 and 1200 m ASL) “captures” these clouds, blocking the way to the interior of the desert.
In the next time-lapse video, you can see clearly the coastal air trapped in the lower part of the atmosphere, something we called the Marine Boundary Layer (MBL). Here, the air is rather misty, full of marine aerosols that tend to produce a more foggy view of the landscape. This marks a big difference with the strong-blue, clear skies above in the free-troposphere.
The MBL is capped by some clouds at ~1.000 m ASL, matching the coastal cordillera’s height, thus bringing liquid water in form of fog deposition or dew, especially during the night and the morning. In fact, this is almost the only source of liquid water for life because rainfall only happens every few years.
Time-lapse of the marine boundary layer along the coast of Atacama. The clear and dry from above contrast with the area with more aerosols and some clouds. Video: José Vicencio. October 2022.
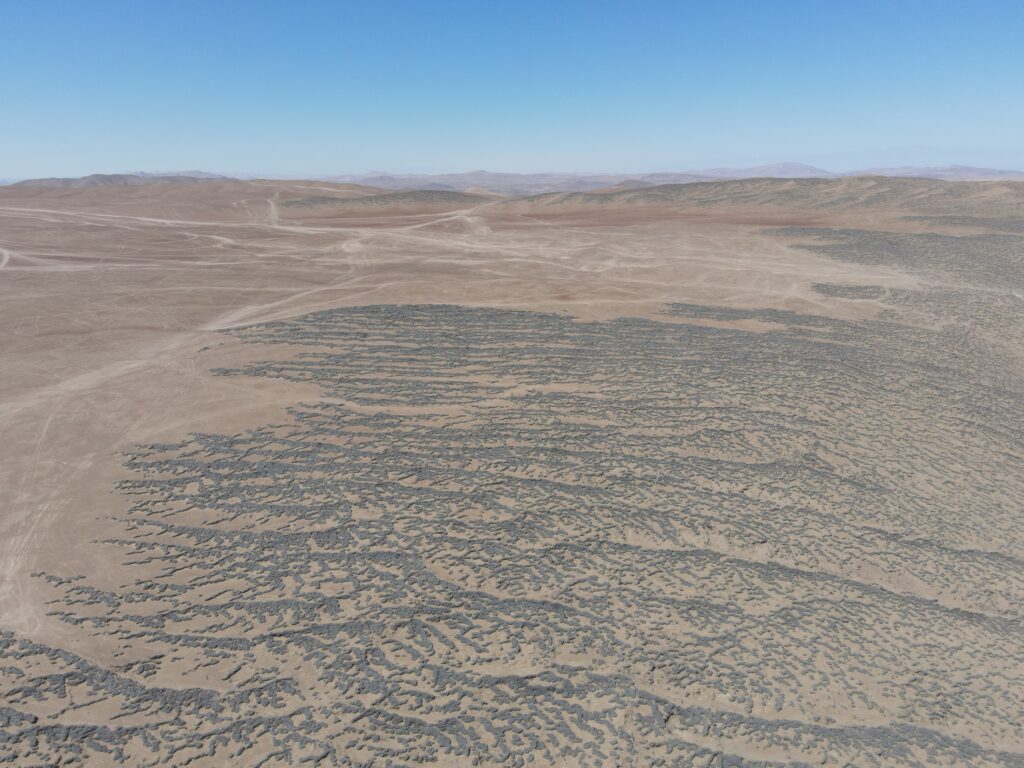
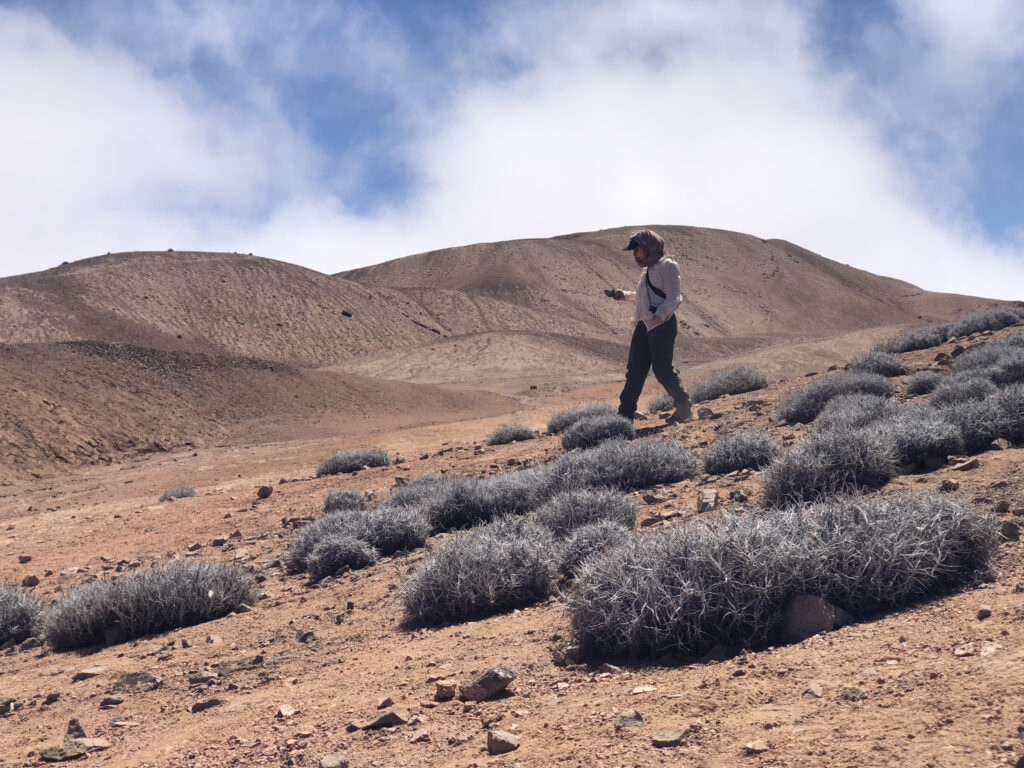
More impressive, some plants are capable of surviving in these areas, only capturing the water from the clouds. In the next video, you can see the crown jewel of biologists: the Tillandsia. Because it is impossible to get water from the ground, this little bush does not develop any roots. Instead, it grows horizontally forming dunes that face the wind direction, allowing to capture of water that comes from the coast with the clouds.
Time-lapse of the clouds arriving to the Tillandsia field in the late afternoon. Video: José Vicencio. October 2022.
As was mentioned before, these plants are able to grow in curvy shapes over small dunes, facing the main wind direction and therefore maximizing the water capture.
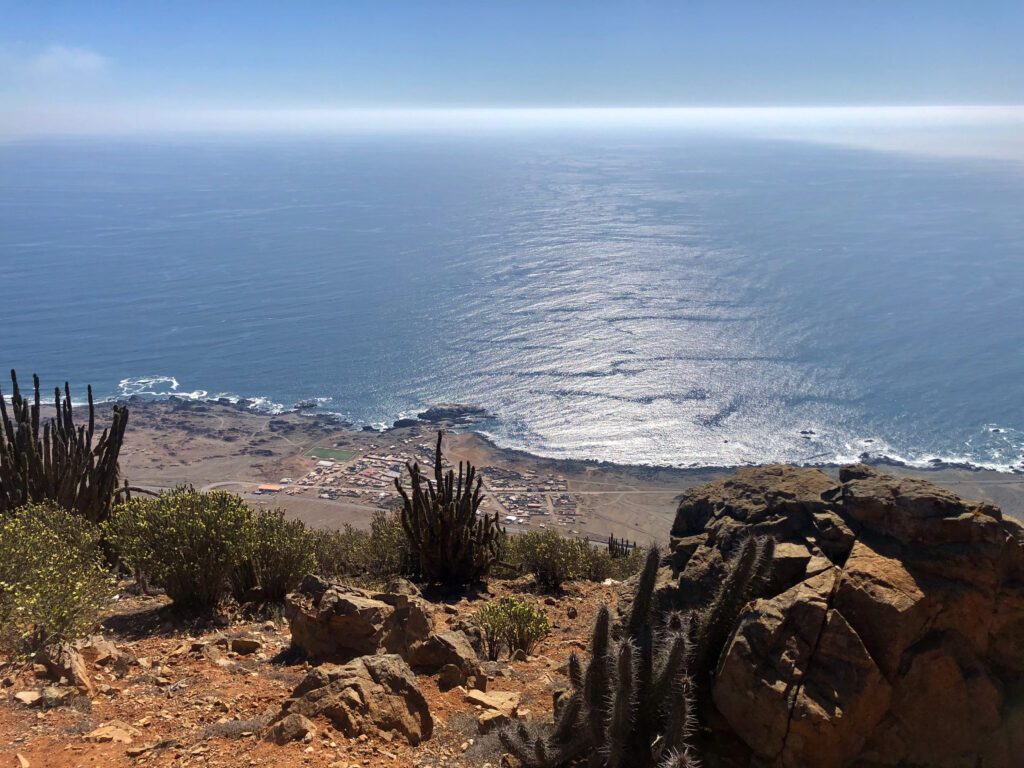
Tillandsia field using a drone. Photo: Dr. Fabian Reddig.defaultDr. Johanna Möbus (B01 – Heidelberg Uni.) walking in the Tillandsia Field with the clouds approaching in the back. Photo: José Vicencio.The Pacific Ocean and the small town of Paposo. Photo: José Vicencio.
The Atacama’s coastal cordillera is spectacular. Life blooms with just a few millimeters of cloud water, even in a dry and warm environment like this.
Along the coast, the main cities also grew, attracting people from all over the world due to the fishing, mining and tourism.
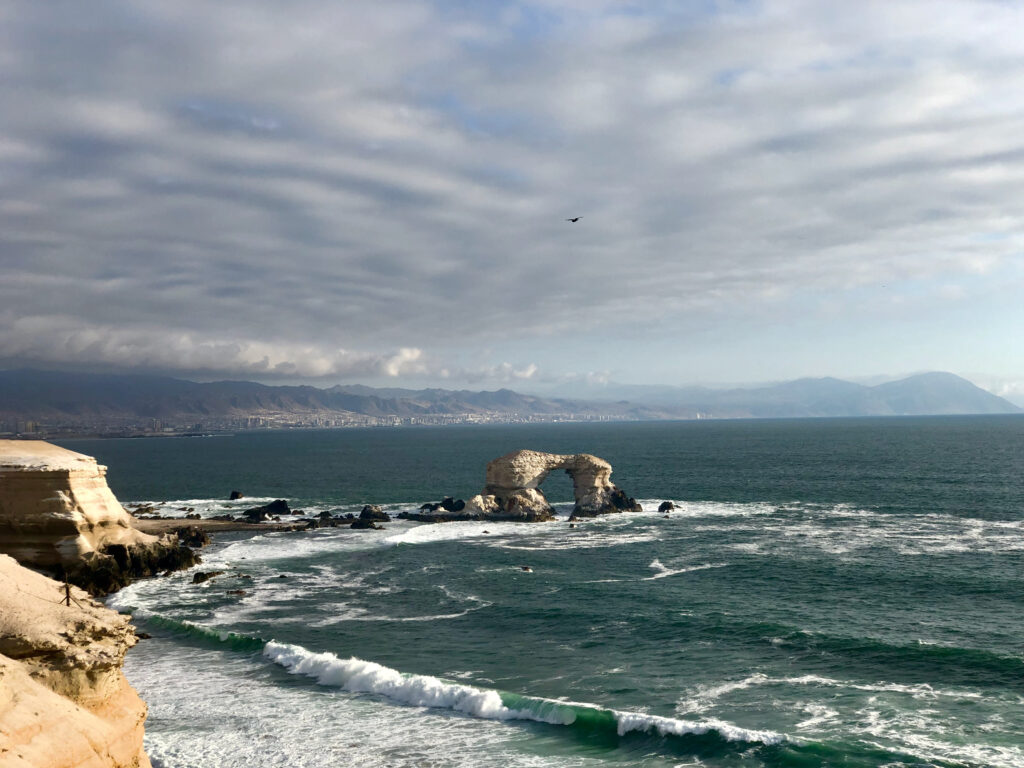
“La Portada” monument, a classic spot to visit in Antofagasta, Chile.
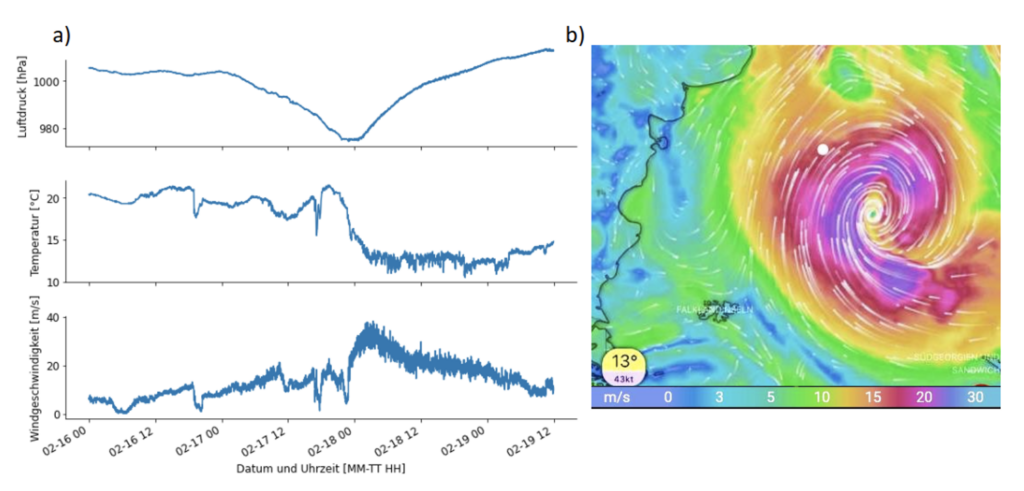
The last few days were quite rough. After crossing the 40° S, we encountered a heavy storm shaking us thoroughly. It gave us wind speeds of up to 140km/h, 12m high waves and rolling the ship from side to side by nearly 45°. Everything on the ship had to be fastened to not go flying about and walking became a real challenge – not even to mention in a straight line.
Luckily the storm weakened after two days bringing the relieve of a good night of sleep again. With the ships movement during the storm even that became impossible, rolling us around in our beds, feeling weightless in one moment and three times heavier than normally in the next.
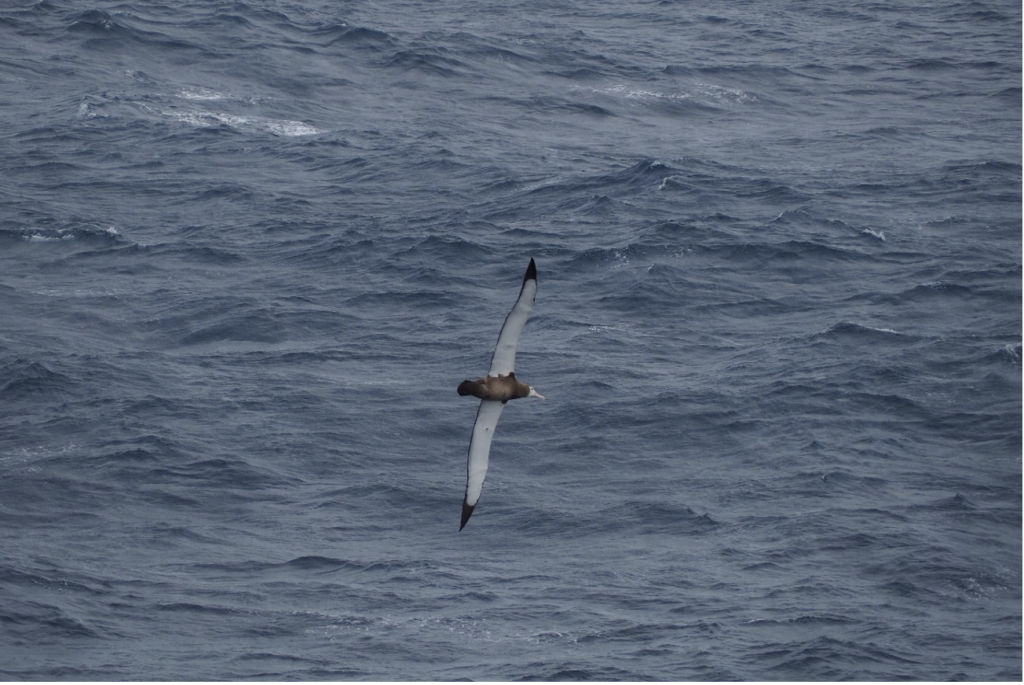
While we are now passing the Falkland Islands and approaching the Magellan Straight, plenty of wildlife is popping up: albatrosses and other flocks of birds have been accompanying the ship since yesterday and some lucky people even saw whales!
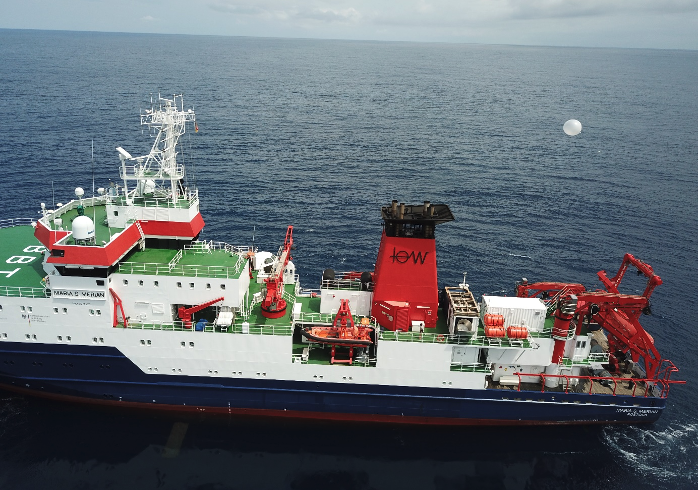
Apart from watching wildlife, we are kept busy with writing cruise reports, backing-up data and preparing the instruments for packing. Tomorrow we will reach Punta Arenas and are sad that the campaign is already over. It was great fun working together with the amazing crew of Maria S. Merian, with so many enthusiastic scientists from very different fields, taking measurements in the middle of the Atlantic Ocean and especially very closely experiencing the features that we observed.
1. An albatross seen from the ship’s observation deck. (Picture by Daria Paul UoC)Meteorological situation while crossing the storm which had its strongest phase during the night between February 17 and February 18. (a) Air pressure (upper), temperature (middle) and wind speed (lower) measured by the on-board weather station. (b) Windspeed map from windy.de for the morning of February 18. The ship Maria S. Merian is marked by the white dot.
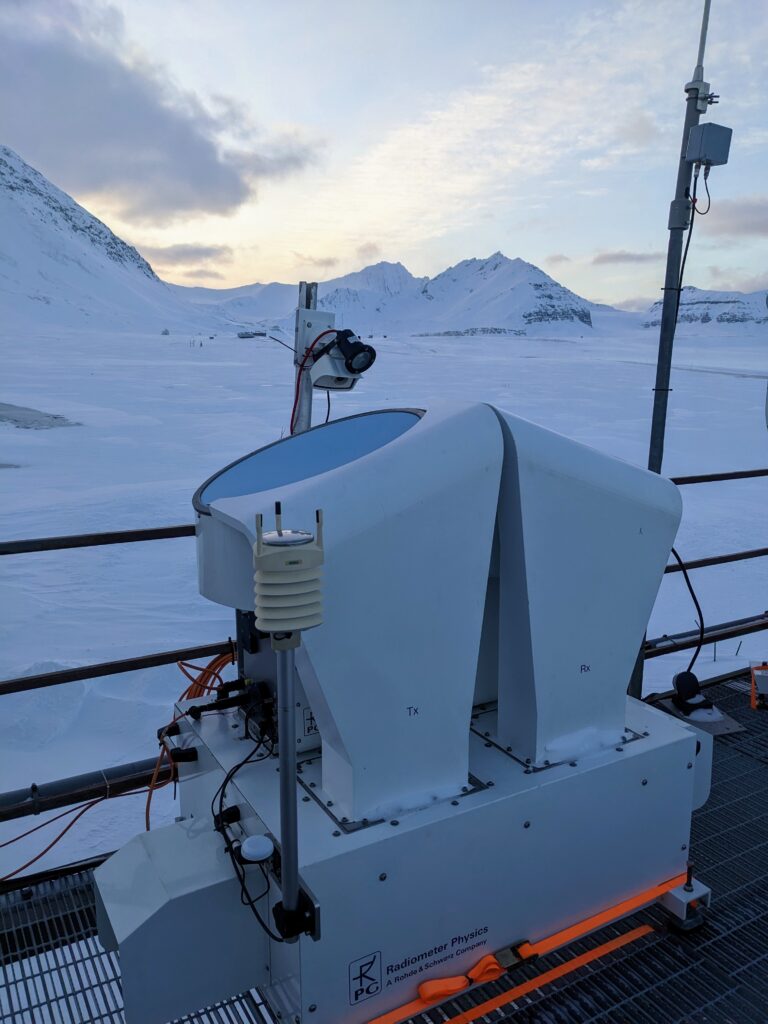
This week Mario and myself traveled to Ny-Ålesund, Svalbard, to exchange our cloud radar MiRAC-A with the cloud radar JOYRAD94. Since MiRAC-A is needed for campaign preparations, it has to travel back to Germany. Swapping the instruments on the roof of the atmospheric observatory of AWIPEV (https://www.awipev.eu/) went very smoothly.
Crane operation to lift the cloud radar JOYRAD94 on top of the AWIPEV atmospheric observatory
Thanks also to the AWIPEV and Kingsbay support! What a wonderful place to do measurements!
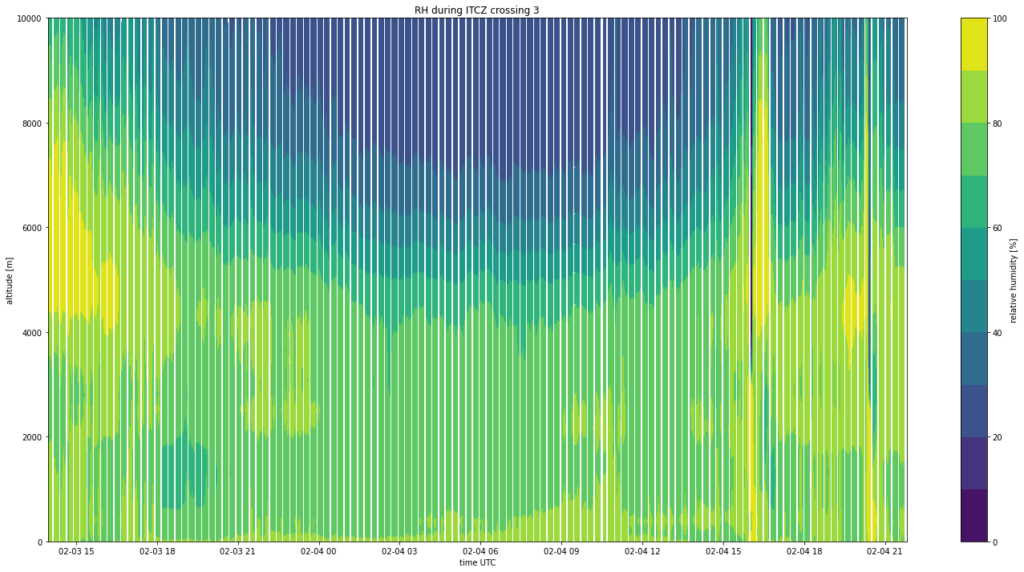
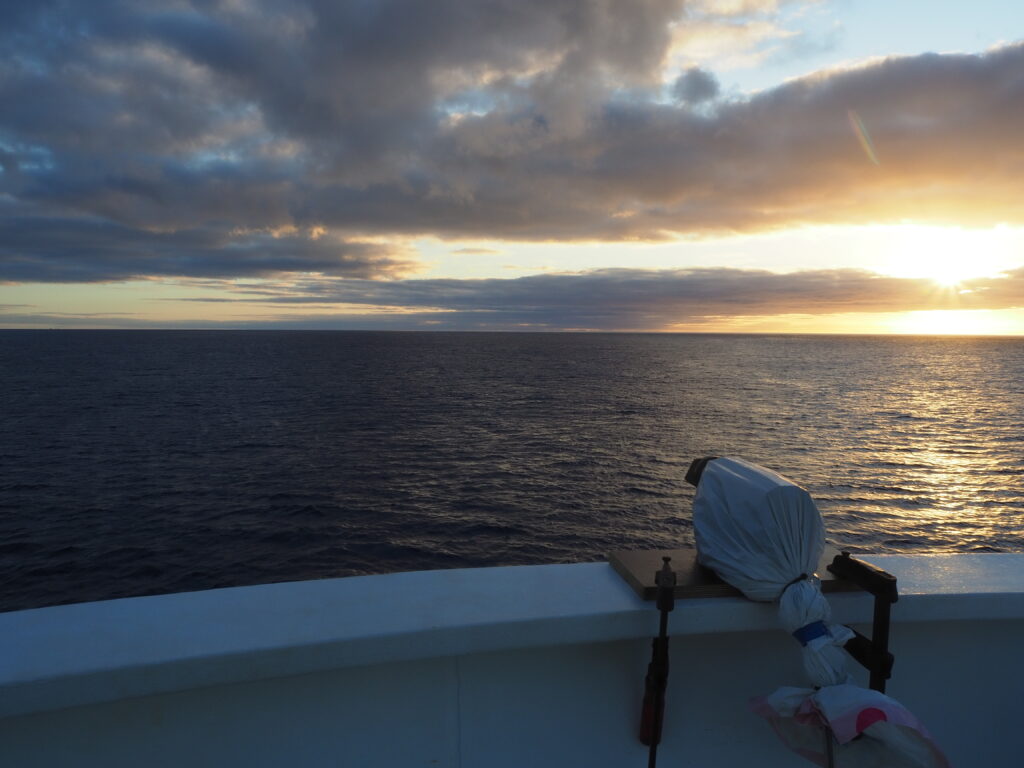
Last week, we left the ITCZ and are now heading straight toward Punta Arenas. The new free time, we, therefore, spend with first data analysis. During the third crossing of the ITCZ we for example experienced and measured a strong doldrum with no wind and very little water vapor content in an otherwise very moist environment.
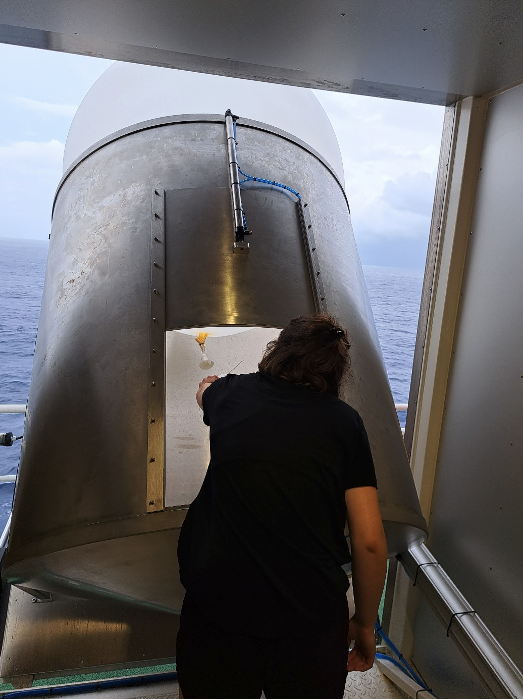
Apart from the data analysis, we used the last few days for two new projects: we launched three more radiosondes during AEOLUS satellite overpasses to help validate its wind profiles and started a little test series with a KT19. The KT19 is a passive infrared “camera” measuring the sea surface skin temperature to estimate the sea emissivity.
After three weeks alone on the ocean, we saw the first ship on the horizon yesterday since we left the port in Mindelo! As we’re currently approaching the “roaring forties”, we have very rough weather ahead of us the next few days before we cross the “furious fifties” and finally reach the Magellan Strait, where we hopefully have some chances of seeing whales 😊.
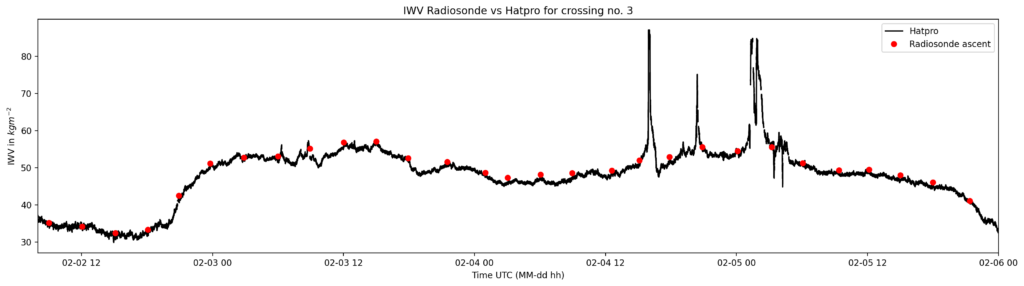
Vertical profile of the atmosphere’s relative humidity up to 10.000m within the central ITCZ during the third crossing.The KT19 sitting at the ship’s bow looks down at the water surface with a special mirror construction. (Picture by Daria Paul, UoC)Time series of the integrated water vapor (IWV) from the HATPRO as a black line, IWV computed from the radiosonde’s humidity measurements as red dots.
Two weeks ago, we, Lennéa and Daria, joined the cruise MSM114/2 (ARC) on the RV Maria S. Merian together with an interdisciplinary group of scientists from the MPI-M in Hamburg, the Hafencity University, the University of Cologne, the Royal Dutch Meteorological Institute, and the Polish Academy of Sciences.
The goal is to use the vessels transit from Mindelo on Cabo Verde to Punta Arenas in Chile (23.1. – 23.2.23) to investigate tropical convection within the Intertropical Convergence Zone (ITCZ), which we zig-zagged three times on our way south. On the way, we collect meteorological reference measurements. In contrast, others measure the ocean depth with sonars and conduct CTDs to learn more about the protistan community’s diversity and composition.
We joined the cruise with a microwave radiometer HATPRO (Humidity And Temperature PROfiler). The HATPRO faces the sky and measures microwave radiation emitted by the atmosphere. Through this, we get continuous profiles of temperature, humidity, liquid water content and water vapor content for the entire cruise.
In addition to the radiometer, we help Laura and Julia from Hamburg launch radiosondes every 3 hours during our journey through the ITCZ for ten days. Getting up at 4:30 in the morning to launch the first radiosonde of our shift isn’t particularly easy, but at least it brings the joy of beautiful tropical sunrises!
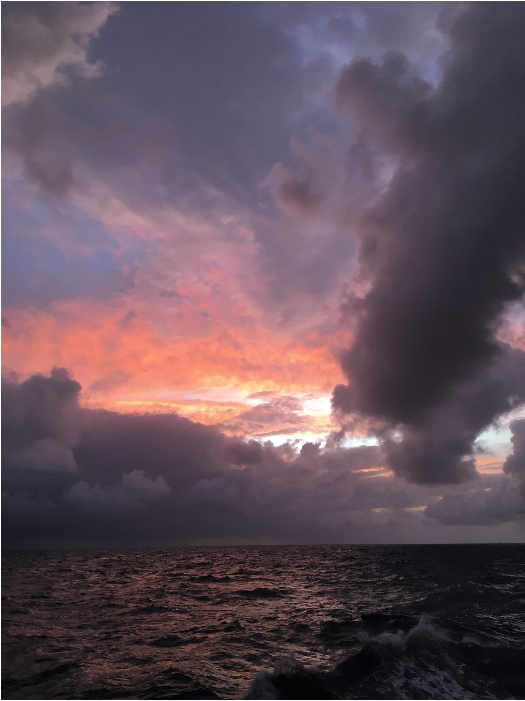
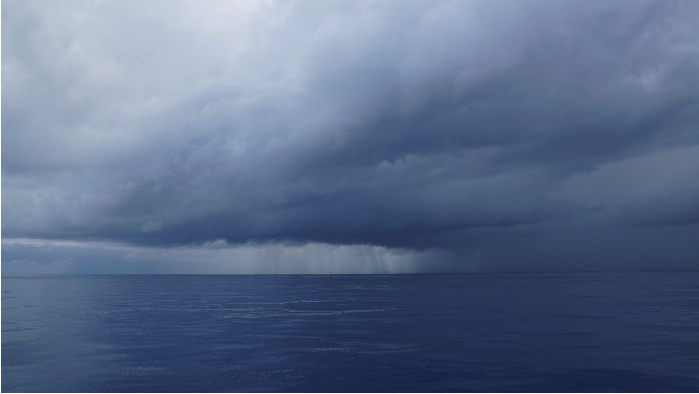
Sunrise in the ITZC in the middle of the Atlantic Ocean after an early radiosonde launch. (Picture by Lennéa Hayo, University of Cologne) Launch of a radiosonde by Daria Paul (University of Cologne) (Picture by Olaf Tuinder, KNMI)Radiosonde launch on Maria S. Merian seen from a drone with sensors for atmospheric profiling (Picture by Daniel Kępski, Institute of Geophysics Polish Academy of SciencesHeavy rain clouds shortly before leaving the ITCZ during the third crossing. (Picture by Julian Wagenhofer, University of Cologne)
After all this time, a pandemic, and lots of efforts, the video is finally out. Take the chance to watch it, let us know your thoughts, and stay tuned… we are working on a live event soon in Cologne 🙂
Videodocumentary on women in science produced by the University of Cologne.
Before closing this post, we want to exploit the chance to really thank all the people who made it possible to realize this video. From the videomakers to the commission members, including all the colleagues that contributed somehow to the realization of the project. It is a collective effort to raise interest on the issue of gender gap in research and find new solutions for a better life for everyone.