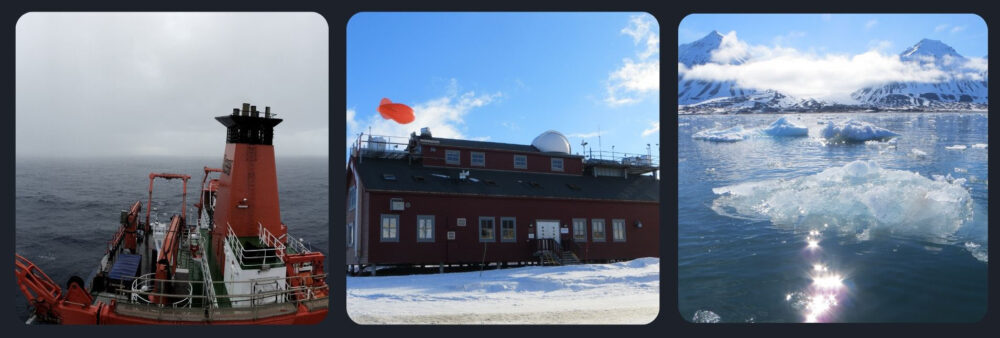
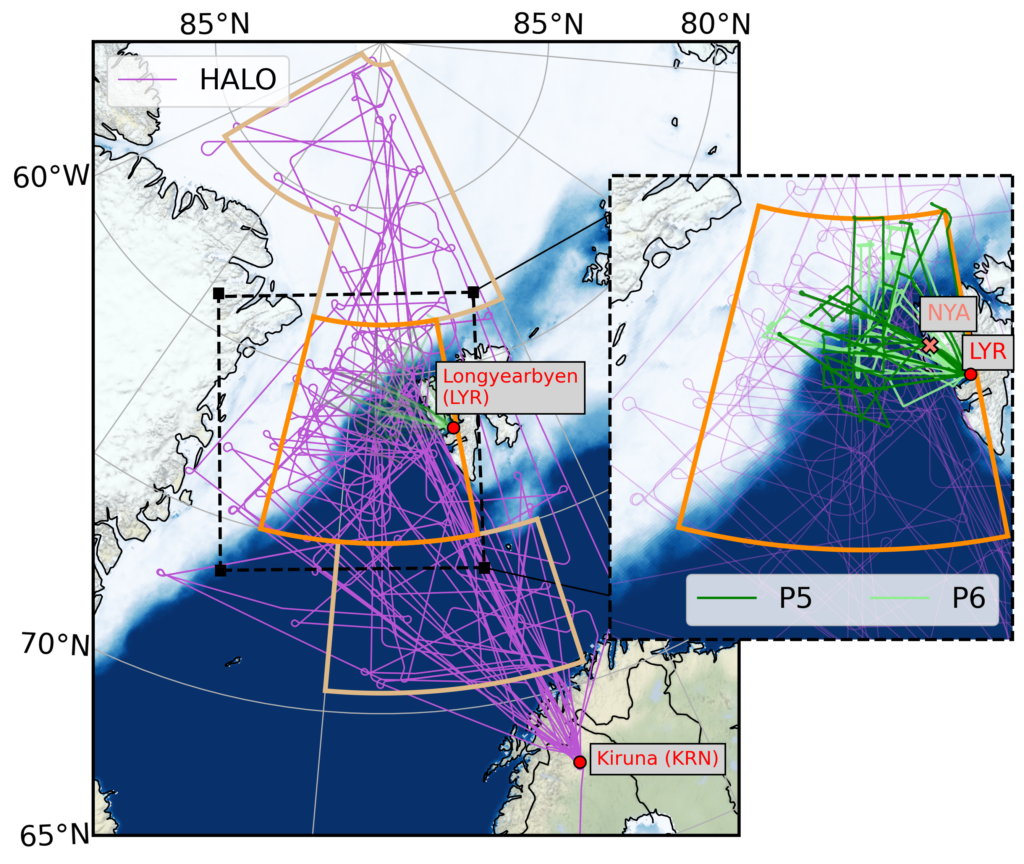
As we reported earlier in this blog, we participated in the airborne field campaign HALO-(AC)³ In March and April 2022. The goal of the campaign was to improve the understanding of the airmasses transformation when transported into or out of the Arctic. Two types of airmass transports were of particular interest: First, moist and warm air intrusions that transport high amounts of heat and moisture from the mid-latitudes into the Arctic. Second, marine cold air outbreaks that lead to the formation of cloud streets and convective cells when cold and dry air from the central Arctic is transported southwards over the relatively warm North Atlantic. In our study, we analyse the weather (and sea ice) conditions during the HALO-(AC)³ campaign.
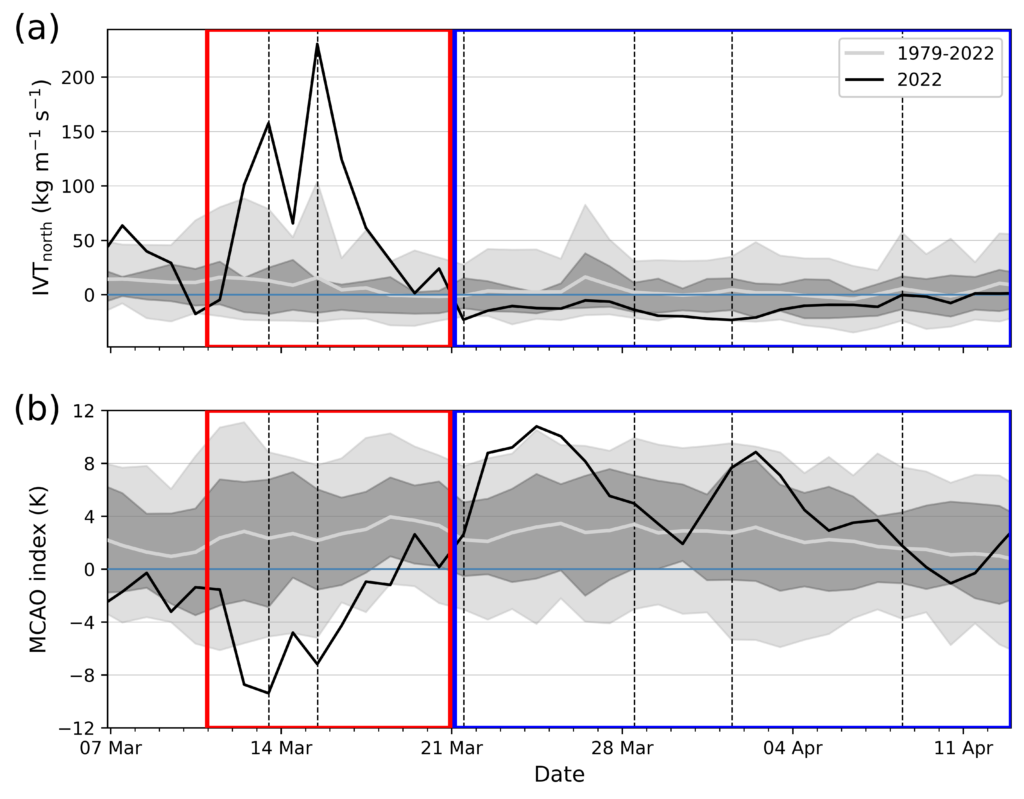
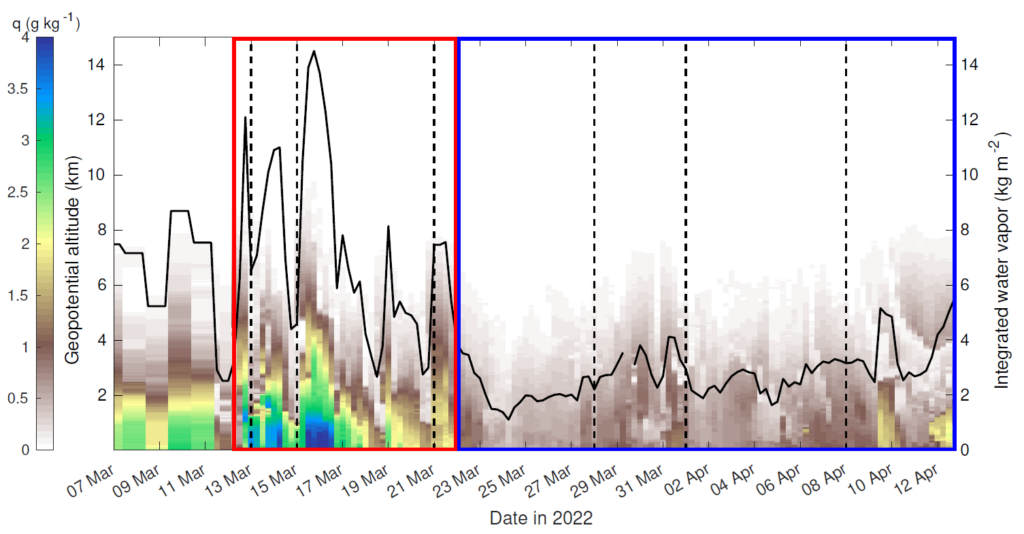
We separated the campaign into a warm and a cold period with the help of northwards humidity transport (IVT) and the so-called cold air outbreak index (MCAO index). The cold air outbreak indicates the strength of the temperature difference between the surface and the lower atmosphere. High differences suggest cold air outbreak conditions with strong interactions between the cold ocean and the atmosphere. The warm period was dominated by northward winds and warm air intrusions while the cold period featured several cold air outbreaks.
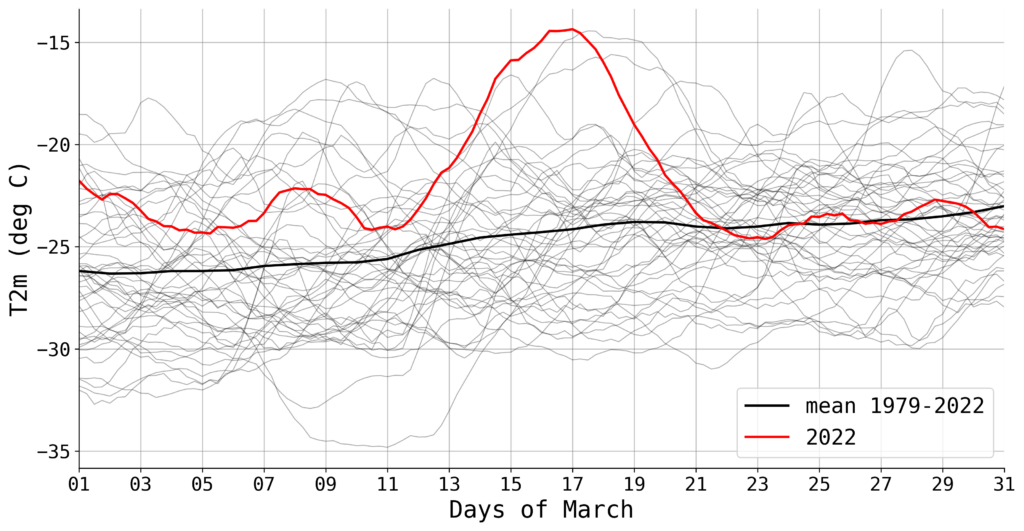
During an extremely strong warm air intrusion, record breaking near-surface temperatures occurred in the central Arctic compared to the March 1979-2022 climatology. Also at Ny-Ålesund, the weather station recorded the highest near-surface temperatures for March since the beginning of the measurements in 1975. This warm air intrusion was detected as so-called Atmospheric River, a thin but long band of extremely strong moisture transport. Over the sea ice northwest of Svalbard, record breaking rainfall rates occurred.
At the beginning of the cold period, a strong cold air outbreak led to an extremely dry atmosphere over Ny-Ålesund with integrated water vapour content of just 1.1 kg m-2 (24 March 2022). Less than 3 % of all radiosondes launched since 1993 recorded drier conditions.
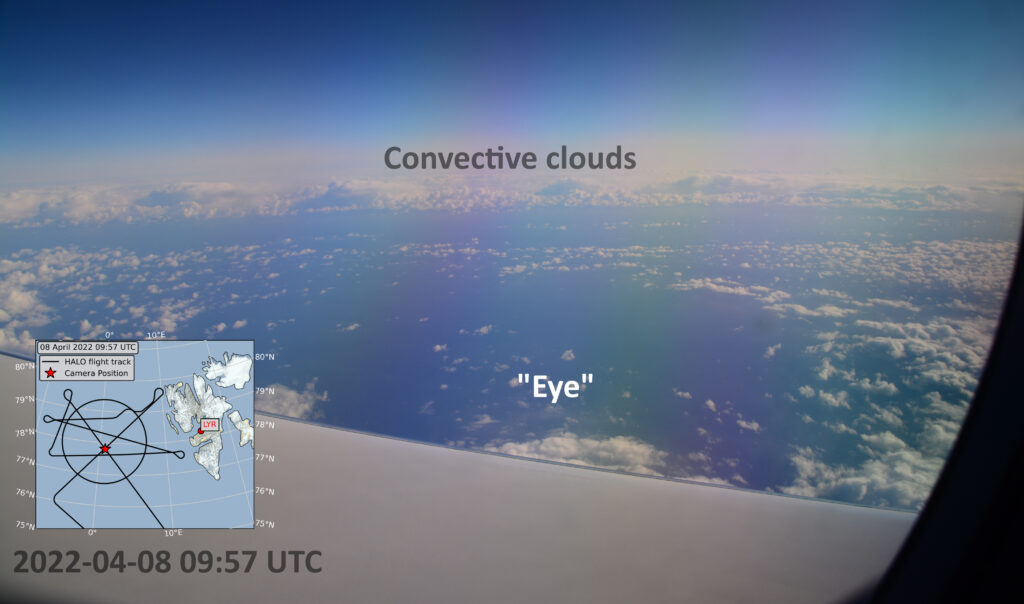
During the cold period, we also observed the Arctic version of a hurricane, a Polar Low. Polar Lows are characterised by convective (cumulus) clouds, relatively strong winds (at least gale force) and precipitation, while extending only over a few 100 kilometers. They also have a relatively cloud free centre like the eye of a hurricane. We analysed the environmental conditions for the formation of the Polar Low.
Luckily, the weather conditions were quite favourable to achieve the goals of the campaign because we could capture both types of airmass exchange between mid-latitudes and the Arctic. The publication has been submitted to the European Geosciences Union journal Atmospheric Chemistry and Physics.