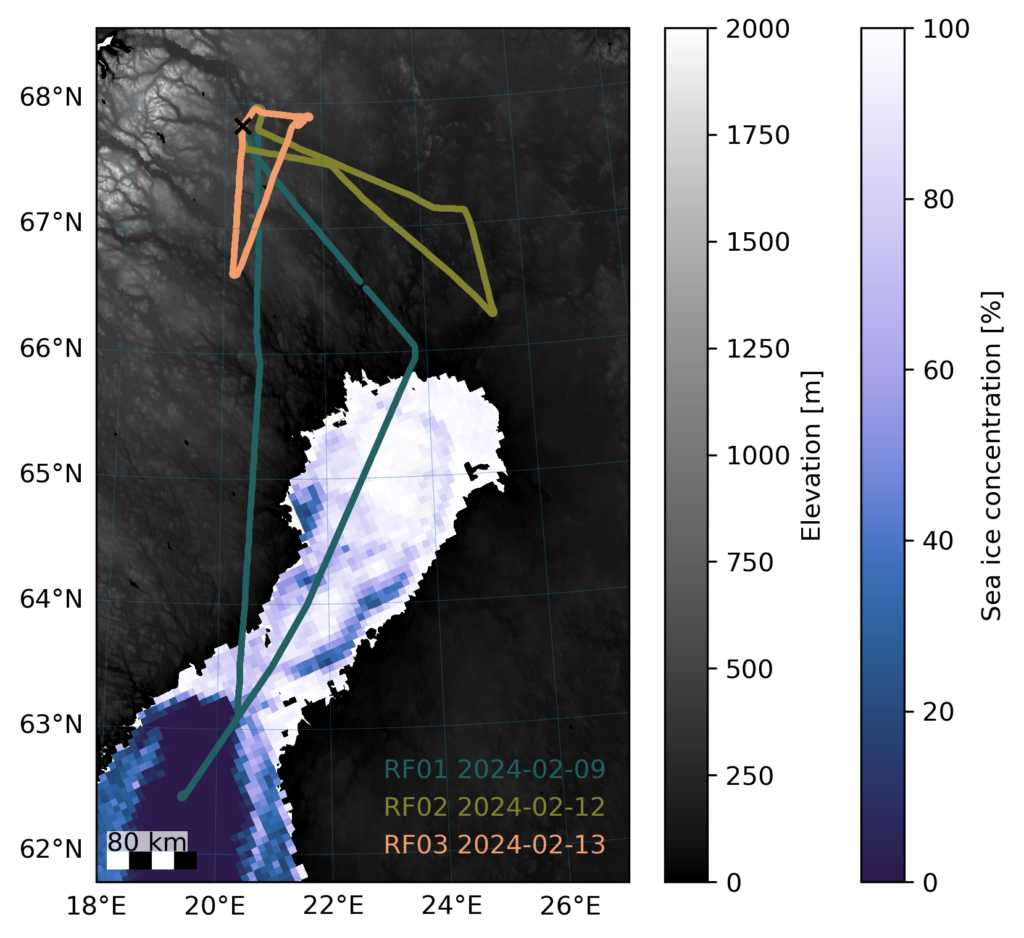
As we reach the midpoint of HAMAG, let’s reflect on the campaign thus far. Our initial three flights have covered the region south and southeast of Kiruna and over the Bothnian Bay. The map below with a digital elevation model and sea ice concentration from the University of Bremen provides an overview of our flight trajectories.
The sea ice concentration map illustrates the closed sea ice in the northern bay and the open ocean towards the south on 9 February 2024. The transect of flight RF01 on this date covered both areas of the Bothnian Bay. Meanwhile, the other two flights focused on low clouds and fog formations over land.
We will continue to update this map to include upcoming research flights.