Today, we took off at 10 am for the first survey flight over Bothnian bay – GRaWAC’s, our new G-band radar system’s, first time in the air! Fair weather conditions over the bay and great conditions for emissivity measurements over the frozen, clear-sky Northern bay part. Clouds were scarce, but once we reached open ocean, we started seeing them from the window, and in our radar measurements, well organized.
Cables, converters, bellypod, racks, seat plan, dropsonde launcher, calibration, ground test, documentation, certification, metric or imperial … … … curious to learn more about how integration looks like?
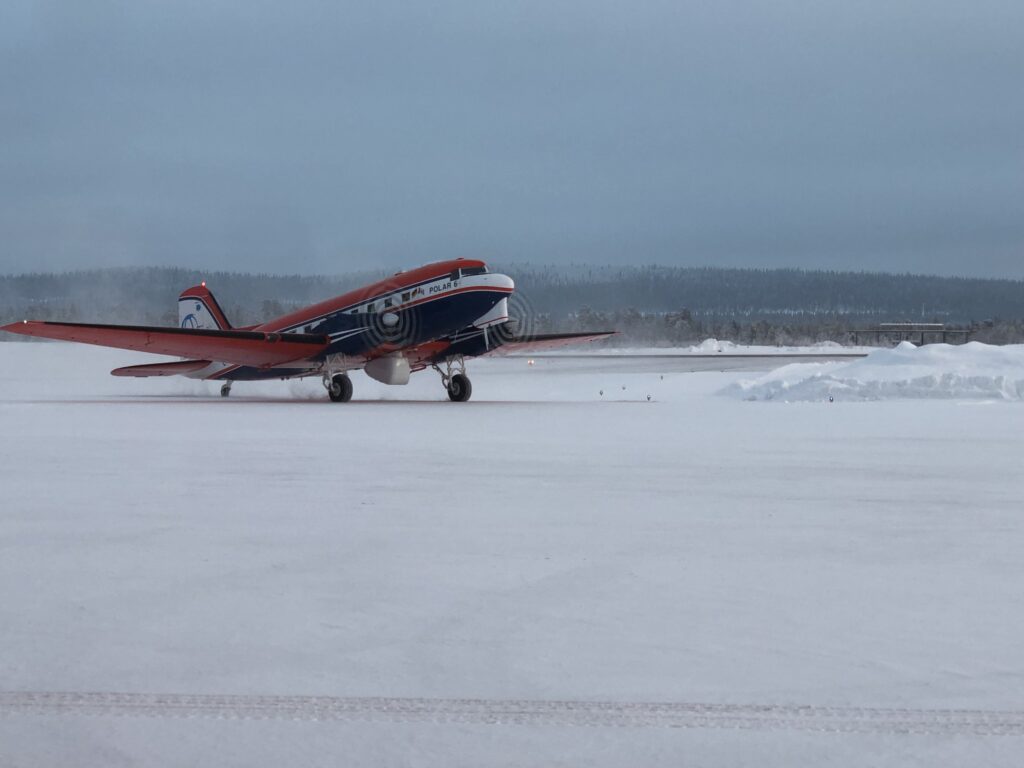
Together with the AWI engineers and KennBorek mechanic, we started installing our instruments aboard the Polar-6 aircraft in the hangar at Bremen airport. Generally, the instruments need to be installed securely aboard the aircraft according to the campaign specific cabin layout. Microwave radiometer and lidar are installed in the cabin with a lookout through the belly, while both cloud radars are attached below the plane in a bellypod.
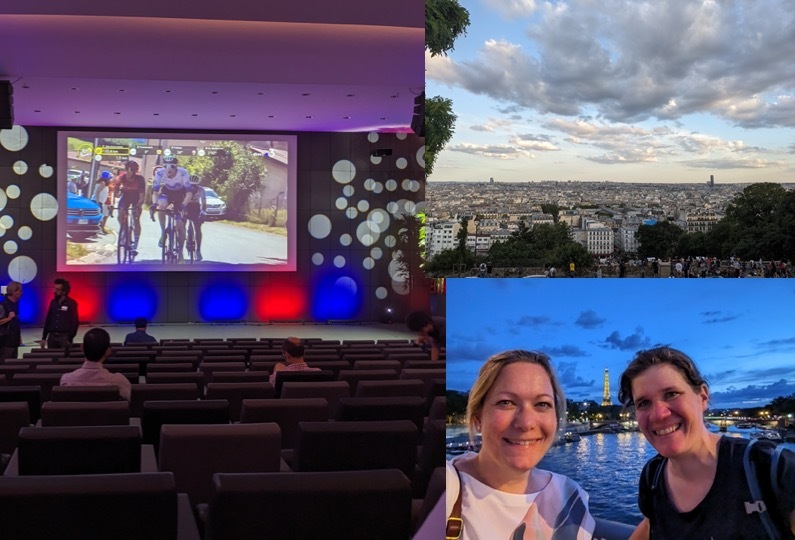
Last week, Kerstin and Vera participated in the joint CFMIP-GASS* meeting in Paris. Apart from presentations and discussions about clouds, convection, circulation, and climate sensitivity, we even participated (virtually) in the Tour de France during the lunch break!
*CFMIP: Cloud Feedback Model Intercomparison Project & GASS: Global Energy and Water Exchanges (GEWEX)’s Global Atmospheric System Studies
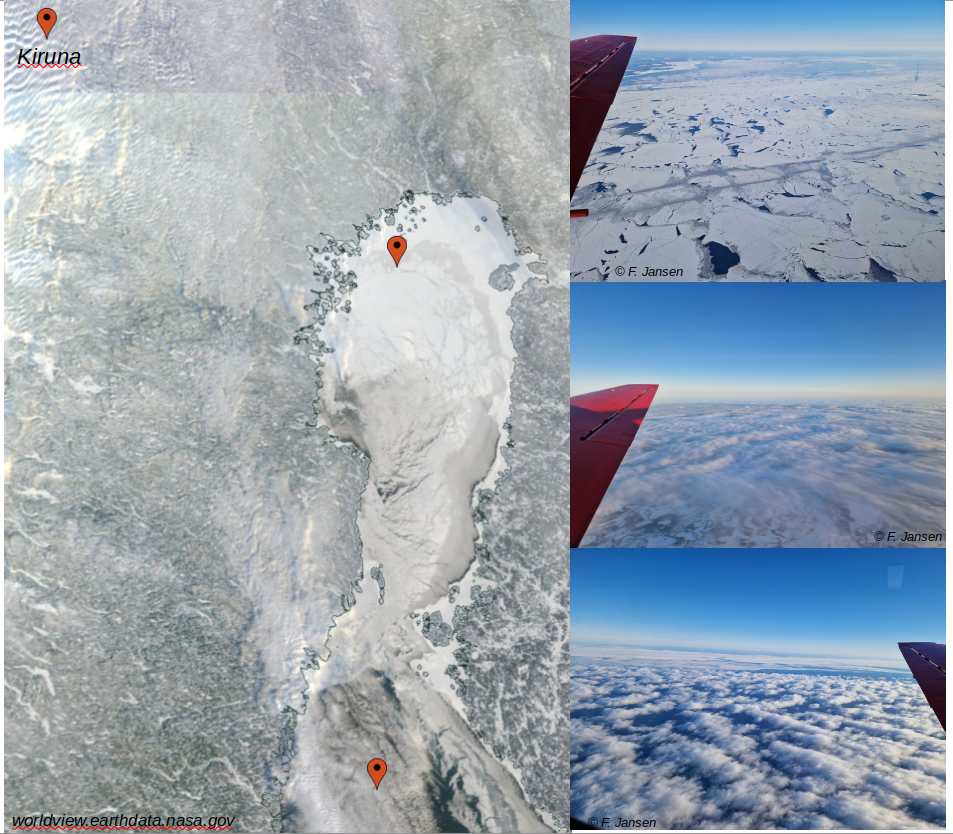
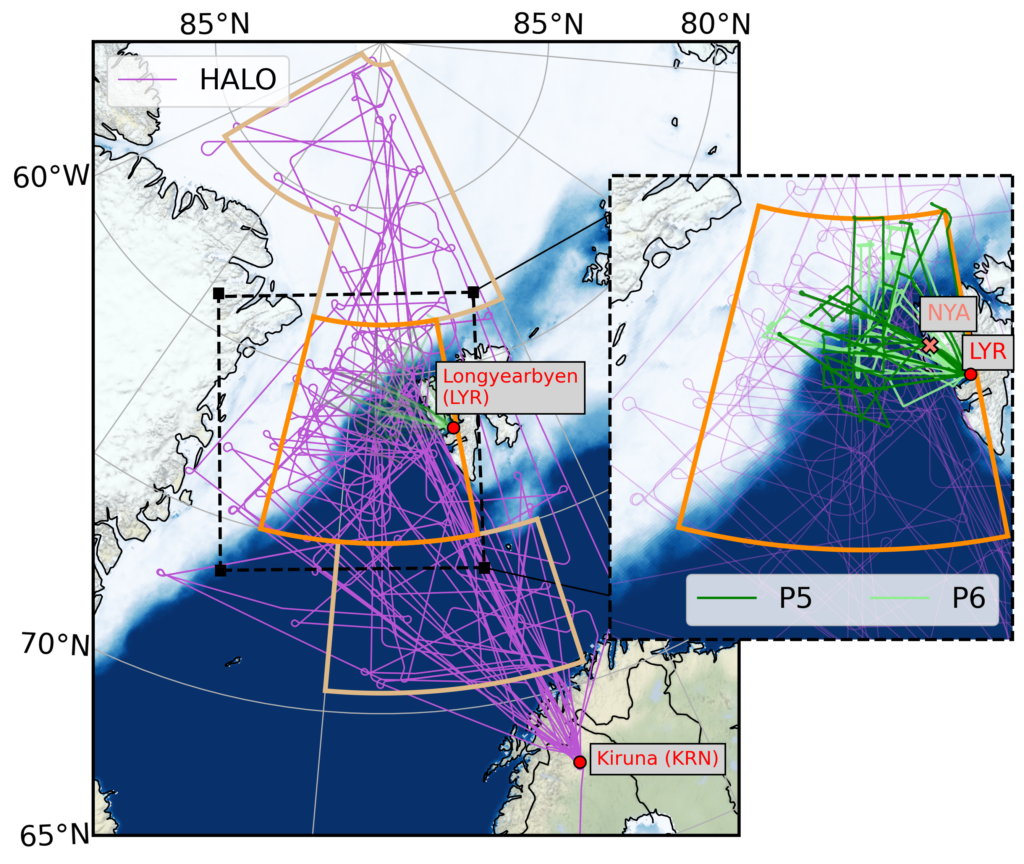
As we reported earlier in this blog, we participated in the airborne field campaign HALO-(AC)³ In March and April 2022. The goal of the campaign was to improve the understanding of the airmasses transformation when transported into or out of the Arctic. Two types of airmass transports were of particular interest: First, moist and warm air intrusions that transport high amounts of heat and moisture from the mid-latitudes into the Arctic. Second, marine cold air outbreaks that lead to the formation of cloud streets and convective cells when cold and dry air from the central Arctic is transported southwards over the relatively warm North Atlantic. In our study, we analyse the weather (and sea ice) conditions during the HALO-(AC)³ campaign.
Map of the study area of the HALO-(AC)³ campaign including the flight tracks of the research aircraft HALO, Polar 5 (P5) and Polar 6 (P6). The study area has been separated into three subregions.
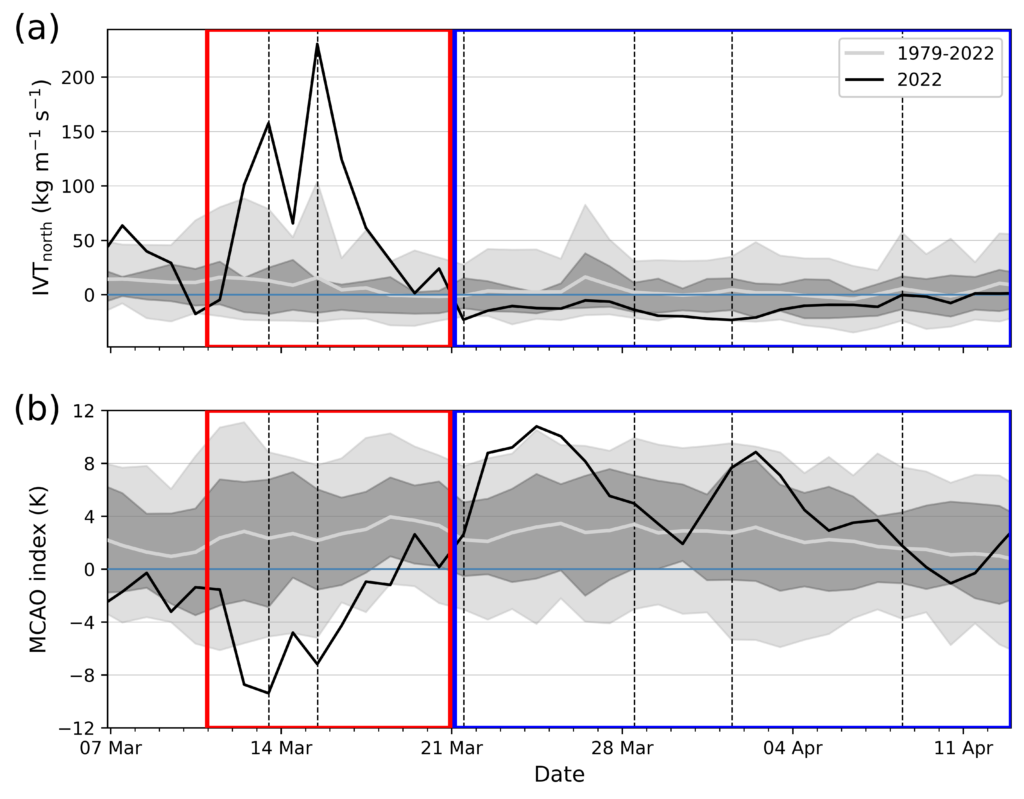
We separated the campaign into a warm and a cold period with the help of northwards humidity transport (IVT) and the so-called cold air outbreak index (MCAO index). The cold air outbreak indicates the strength of the temperature difference between the surface and the lower atmosphere. High differences suggest cold air outbreak conditions with strong interactions between the cold ocean and the atmosphere. The warm period was dominated by northward winds and warm air intrusions while the cold period featured several cold air outbreaks.
(a) Northward water vapour transport (IVTnorth) and (b) marine cold air outbreak (MCAO) index for the campaign duration in 2022 (black line). Grey shading indicates the climatology over the years 1979-2022. The red box shows the warm period, while the blue box illustrates the cold period.
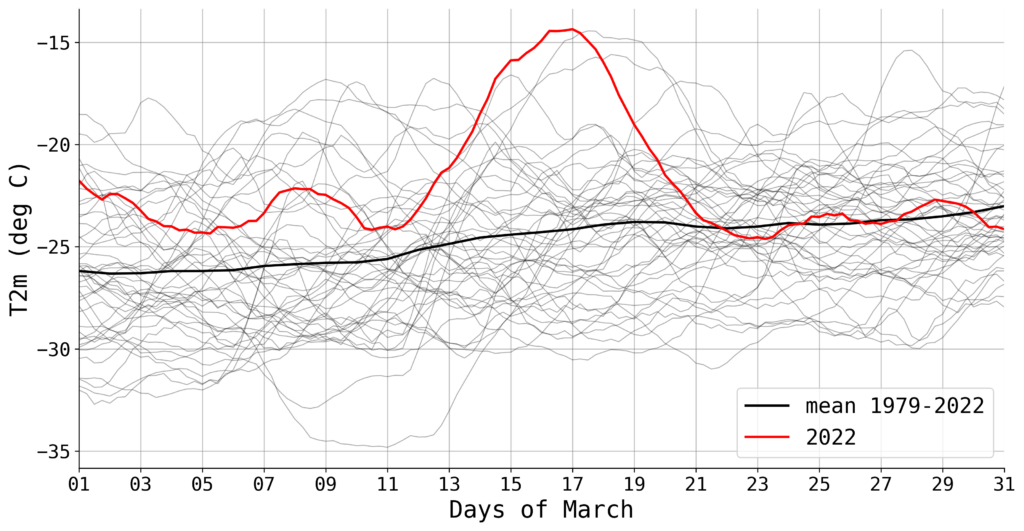
During an extremely strong warm air intrusion, record breaking near-surface temperatures occurred in the central Arctic compared to the March 1979-2022 climatology. Also at Ny-Ålesund, the weather station recorded the highest near-surface temperatures for March since the beginning of the measurements in 1975. This warm air intrusion was detected as so-called Atmospheric River, a thin but long band of extremely strong moisture transport. Over the sea ice northwest of Svalbard, record breaking rainfall rates occurred.
Average 2 m temperature in March 2022 north of 80°N (red line). Thin black lines show the temperature for each year between 1979 and 2022 and the thick black line illustrates the average over those years.
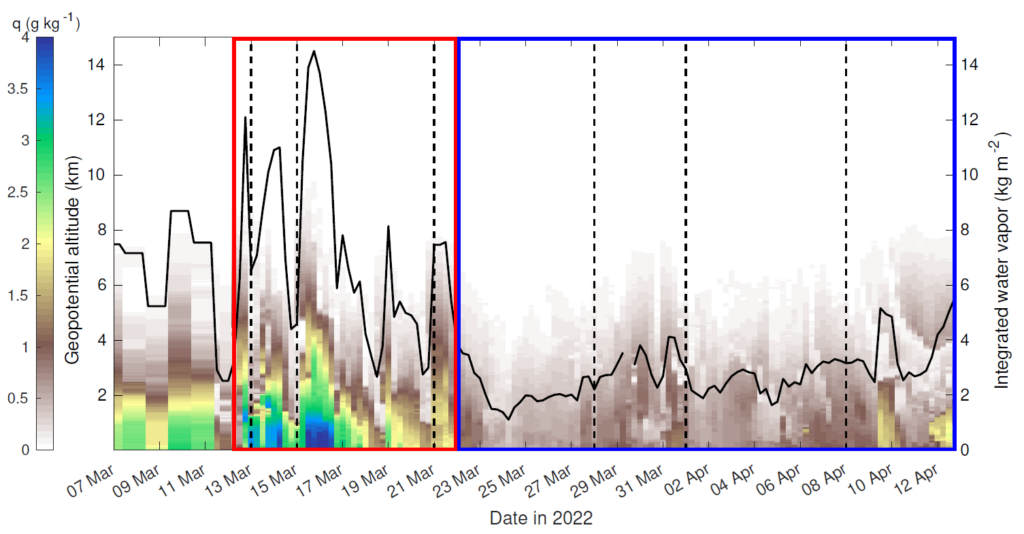
At the beginning of the cold period, a strong cold air outbreak led to an extremely dry atmosphere over Ny-Ålesund with integrated water vapour content of just 1.1 kg m-2 (24 March 2022). Less than 3 % of all radiosondes launched since 1993 recorded drier conditions.
Humidity measurements from radiosondes (weather balloons) launched at Ny-Ålesund (Svalbard) during HALO-(AC)³. The colours indicate the specific humidity (fraction of water vapour mass to total air mass) while the black line shows the total humidity content of the troposphere (lowest layer of the atmosphere).
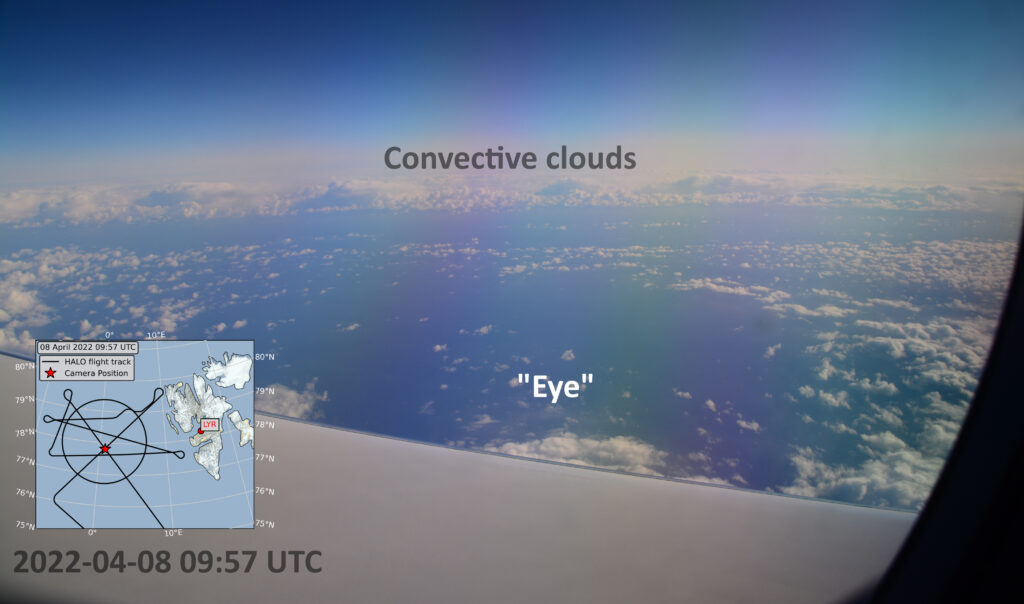
During the cold period, we also observed the Arctic version of a hurricane, a Polar Low. Polar Lows are characterised by convective (cumulus) clouds, relatively strong winds (at least gale force) and precipitation, while extending only over a few 100 kilometers. They also have a relatively cloud free centre like the eye of a hurricane. We analysed the environmental conditions for the formation of the Polar Low.
Photo taken from the research aircraft HALO during the flight to observe the Polar Low.
Luckily, the weather conditions were quite favourable to achieve the goals of the campaign because we could capture both types of airmass exchange between mid-latitudes and the Arctic. The publication has been submitted to the European Geosciences Union journal Atmospheric Chemistry and Physics.
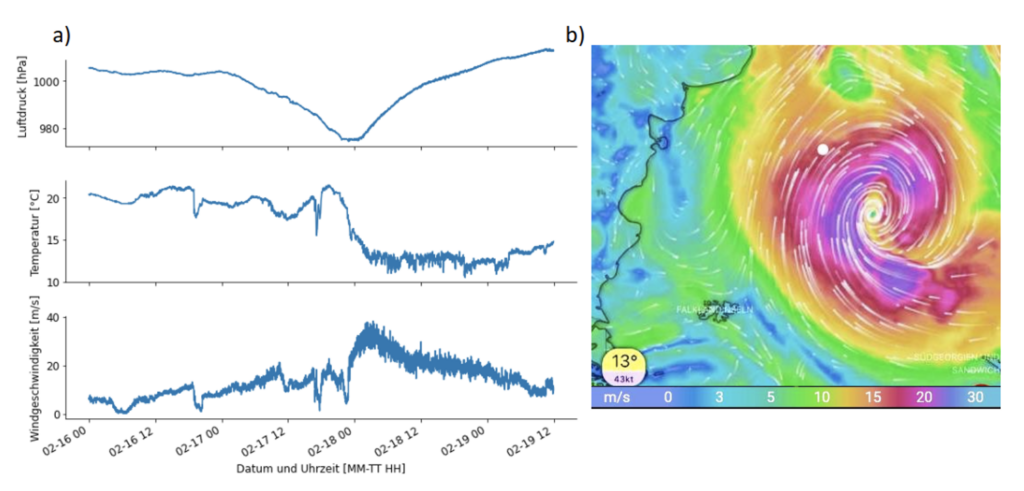
The last few days were quite rough. After crossing the 40° S, we encountered a heavy storm shaking us thoroughly. It gave us wind speeds of up to 140km/h, 12m high waves and rolling the ship from side to side by nearly 45°. Everything on the ship had to be fastened to not go flying about and walking became a real challenge – not even to mention in a straight line.
Luckily the storm weakened after two days bringing the relieve of a good night of sleep again. With the ships movement during the storm even that became impossible, rolling us around in our beds, feeling weightless in one moment and three times heavier than normally in the next.
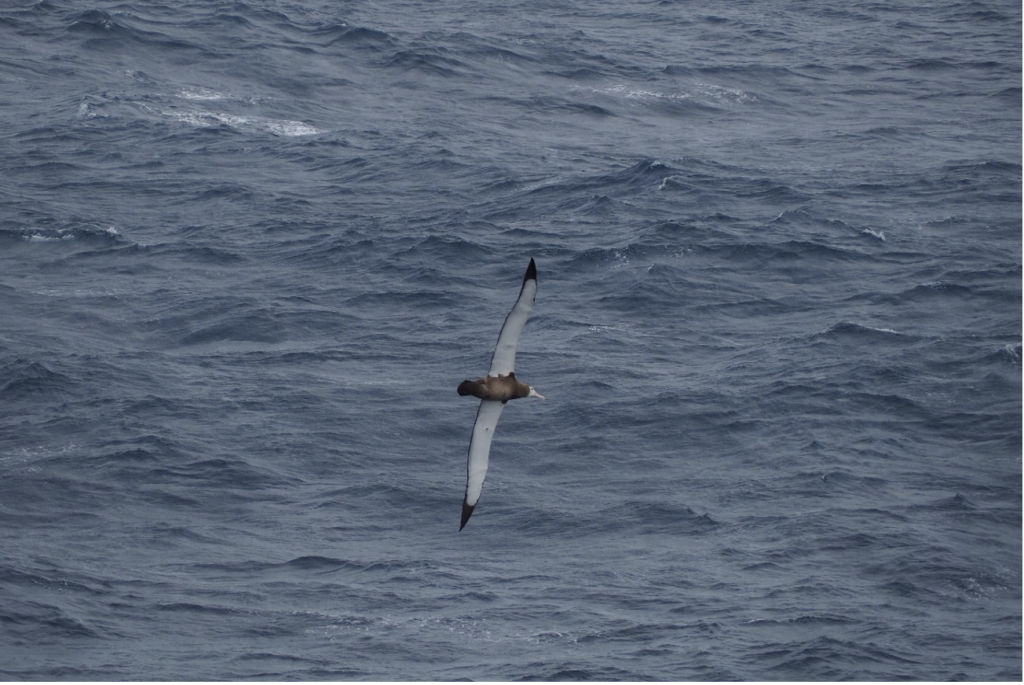
While we are now passing the Falkland Islands and approaching the Magellan Straight, plenty of wildlife is popping up: albatrosses and other flocks of birds have been accompanying the ship since yesterday and some lucky people even saw whales!
Apart from watching wildlife, we are kept busy with writing cruise reports, backing-up data and preparing the instruments for packing. Tomorrow we will reach Punta Arenas and are sad that the campaign is already over. It was great fun working together with the amazing crew of Maria S. Merian, with so many enthusiastic scientists from very different fields, taking measurements in the middle of the Atlantic Ocean and especially very closely experiencing the features that we observed.
1. An albatross seen from the ship’s observation deck. (Picture by Daria Paul UoC)Meteorological situation while crossing the storm which had its strongest phase during the night between February 17 and February 18. (a) Air pressure (upper), temperature (middle) and wind speed (lower) measured by the on-board weather station. (b) Windspeed map from windy.de for the morning of February 18. The ship Maria S. Merian is marked by the white dot.
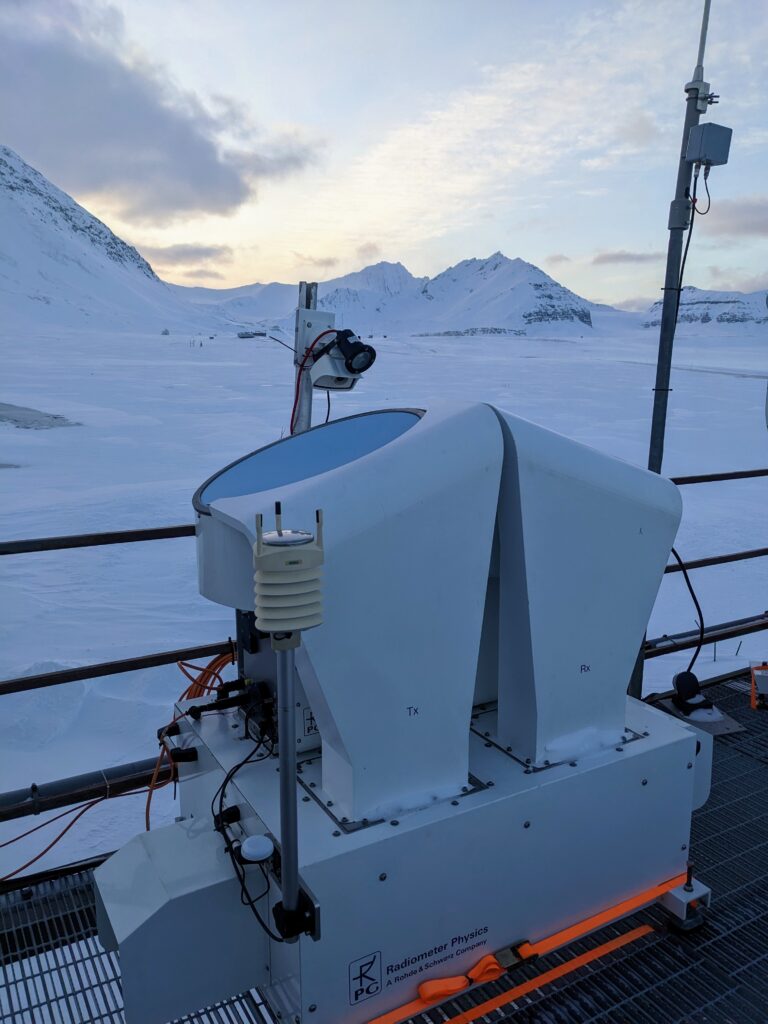
This week Mario and myself traveled to Ny-Ålesund, Svalbard, to exchange our cloud radar MiRAC-A with the cloud radar JOYRAD94. Since MiRAC-A is needed for campaign preparations, it has to travel back to Germany. Swapping the instruments on the roof of the atmospheric observatory of AWIPEV (https://www.awipev.eu/) went very smoothly.
Crane operation to lift the cloud radar JOYRAD94 on top of the AWIPEV atmospheric observatory
Thanks also to the AWIPEV and Kingsbay support! What a wonderful place to do measurements!
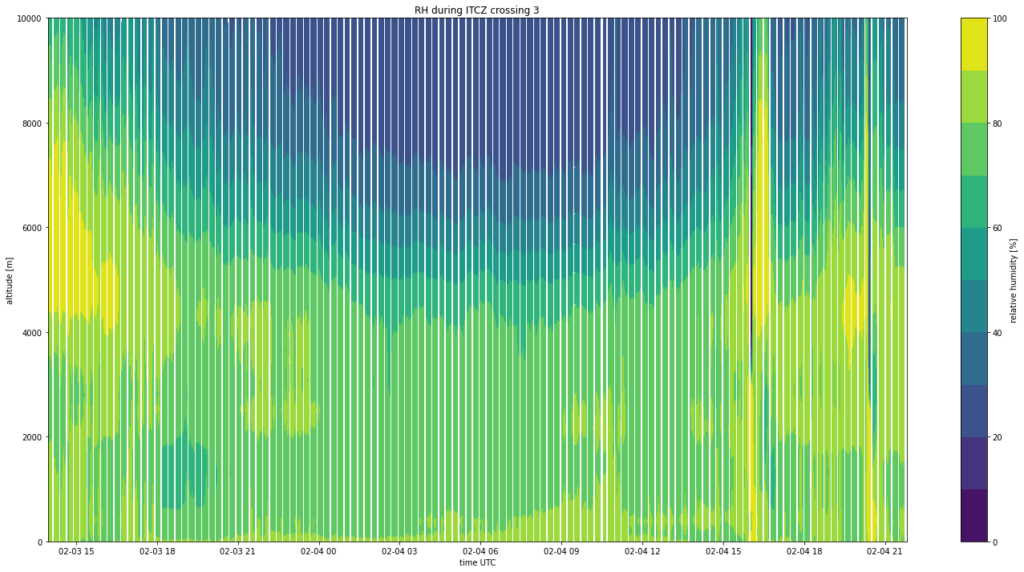
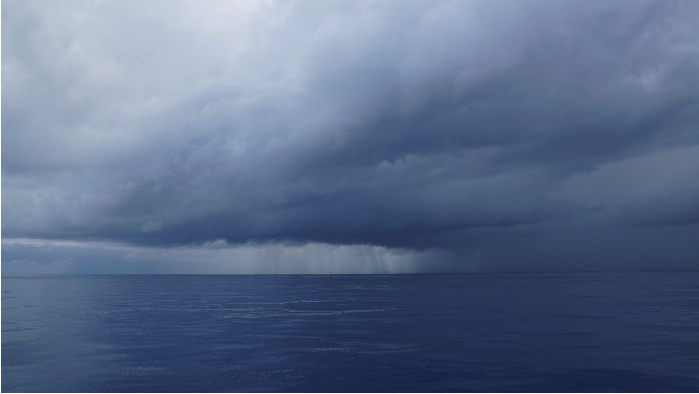
Last week, we left the ITCZ and are now heading straight toward Punta Arenas. The new free time, we, therefore, spend with first data analysis. During the third crossing of the ITCZ we for example experienced and measured a strong doldrum with no wind and very little water vapor content in an otherwise very moist environment.
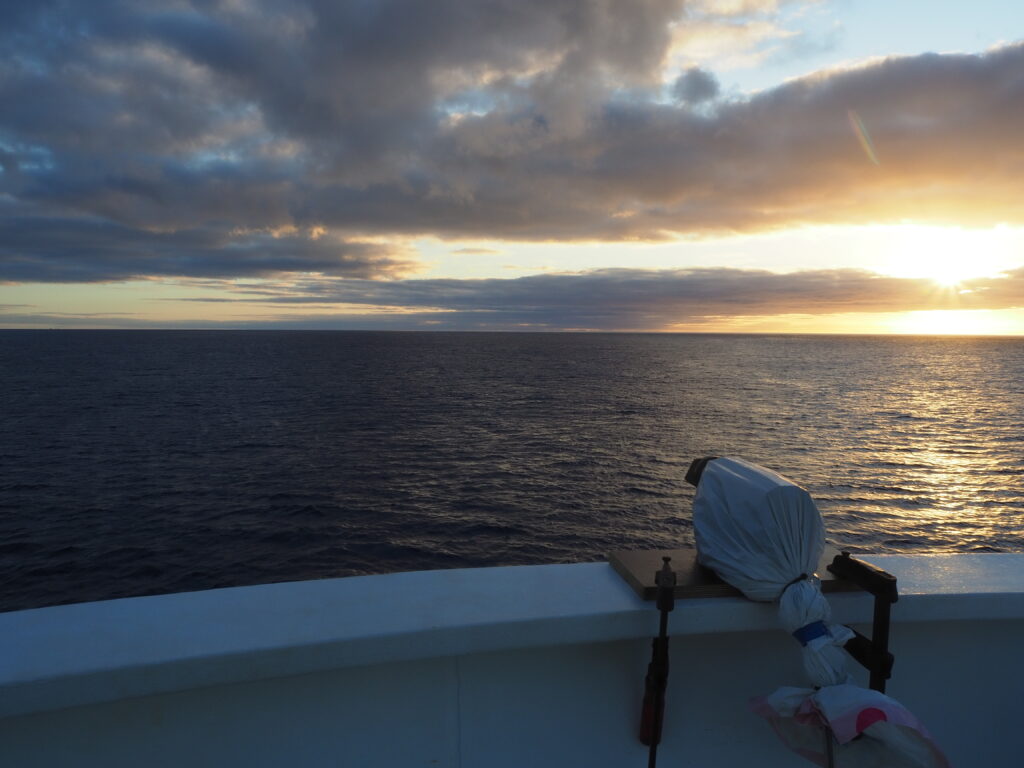
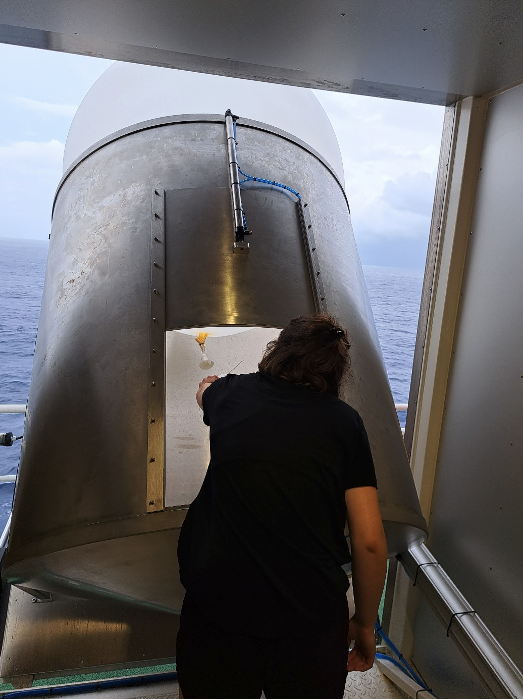
Apart from the data analysis, we used the last few days for two new projects: we launched three more radiosondes during AEOLUS satellite overpasses to help validate its wind profiles and started a little test series with a KT19. The KT19 is a passive infrared “camera” measuring the sea surface skin temperature to estimate the sea emissivity.
After three weeks alone on the ocean, we saw the first ship on the horizon yesterday since we left the port in Mindelo! As we’re currently approaching the “roaring forties”, we have very rough weather ahead of us the next few days before we cross the “furious fifties” and finally reach the Magellan Strait, where we hopefully have some chances of seeing whales 😊.
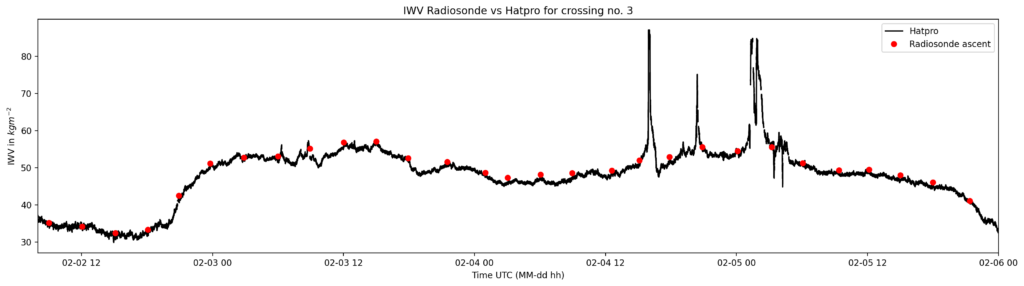
Vertical profile of the atmosphere’s relative humidity up to 10.000m within the central ITCZ during the third crossing.The KT19 sitting at the ship’s bow looks down at the water surface with a special mirror construction. (Picture by Daria Paul, UoC)Time series of the integrated water vapor (IWV) from the HATPRO as a black line, IWV computed from the radiosonde’s humidity measurements as red dots.
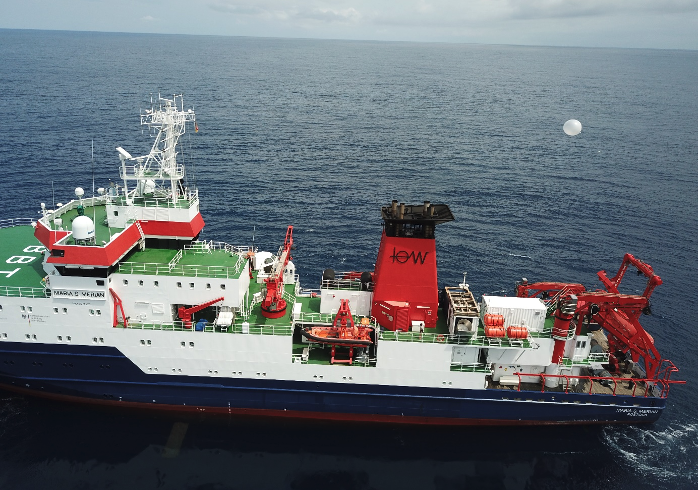
Two weeks ago, we, Lennéa and Daria, joined the cruise MSM114/2 (ARC) on the RV Maria S. Merian together with an interdisciplinary group of scientists from the MPI-M in Hamburg, the Hafencity University, the University of Cologne, the Royal Dutch Meteorological Institute, and the Polish Academy of Sciences.
The goal is to use the vessels transit from Mindelo on Cabo Verde to Punta Arenas in Chile (23.1. – 23.2.23) to investigate tropical convection within the Intertropical Convergence Zone (ITCZ), which we zig-zagged three times on our way south. On the way, we collect meteorological reference measurements. In contrast, others measure the ocean depth with sonars and conduct CTDs to learn more about the protistan community’s diversity and composition.
We joined the cruise with a microwave radiometer HATPRO (Humidity And Temperature PROfiler). The HATPRO faces the sky and measures microwave radiation emitted by the atmosphere. Through this, we get continuous profiles of temperature, humidity, liquid water content and water vapor content for the entire cruise.
In addition to the radiometer, we help Laura and Julia from Hamburg launch radiosondes every 3 hours during our journey through the ITCZ for ten days. Getting up at 4:30 in the morning to launch the first radiosonde of our shift isn’t particularly easy, but at least it brings the joy of beautiful tropical sunrises!
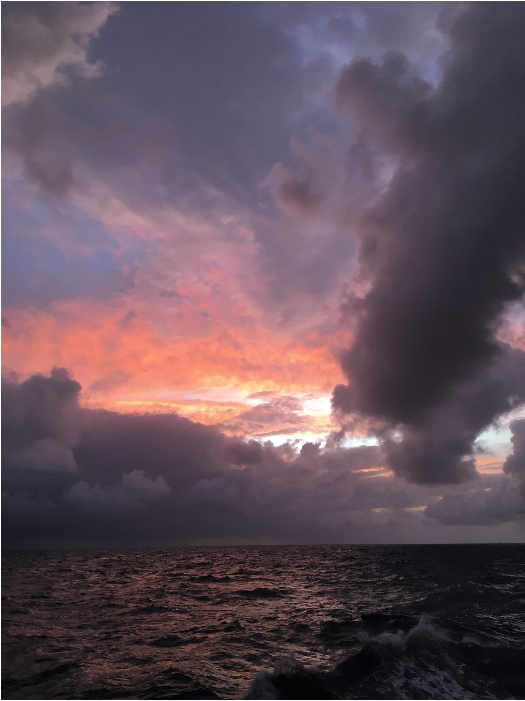
Sunrise in the ITZC in the middle of the Atlantic Ocean after an early radiosonde launch. (Picture by Lennéa Hayo, University of Cologne) Launch of a radiosonde by Daria Paul (University of Cologne) (Picture by Olaf Tuinder, KNMI)Radiosonde launch on Maria S. Merian seen from a drone with sensors for atmospheric profiling (Picture by Daniel Kępski, Institute of Geophysics Polish Academy of SciencesHeavy rain clouds shortly before leaving the ITCZ during the third crossing. (Picture by Julian Wagenhofer, University of Cologne)
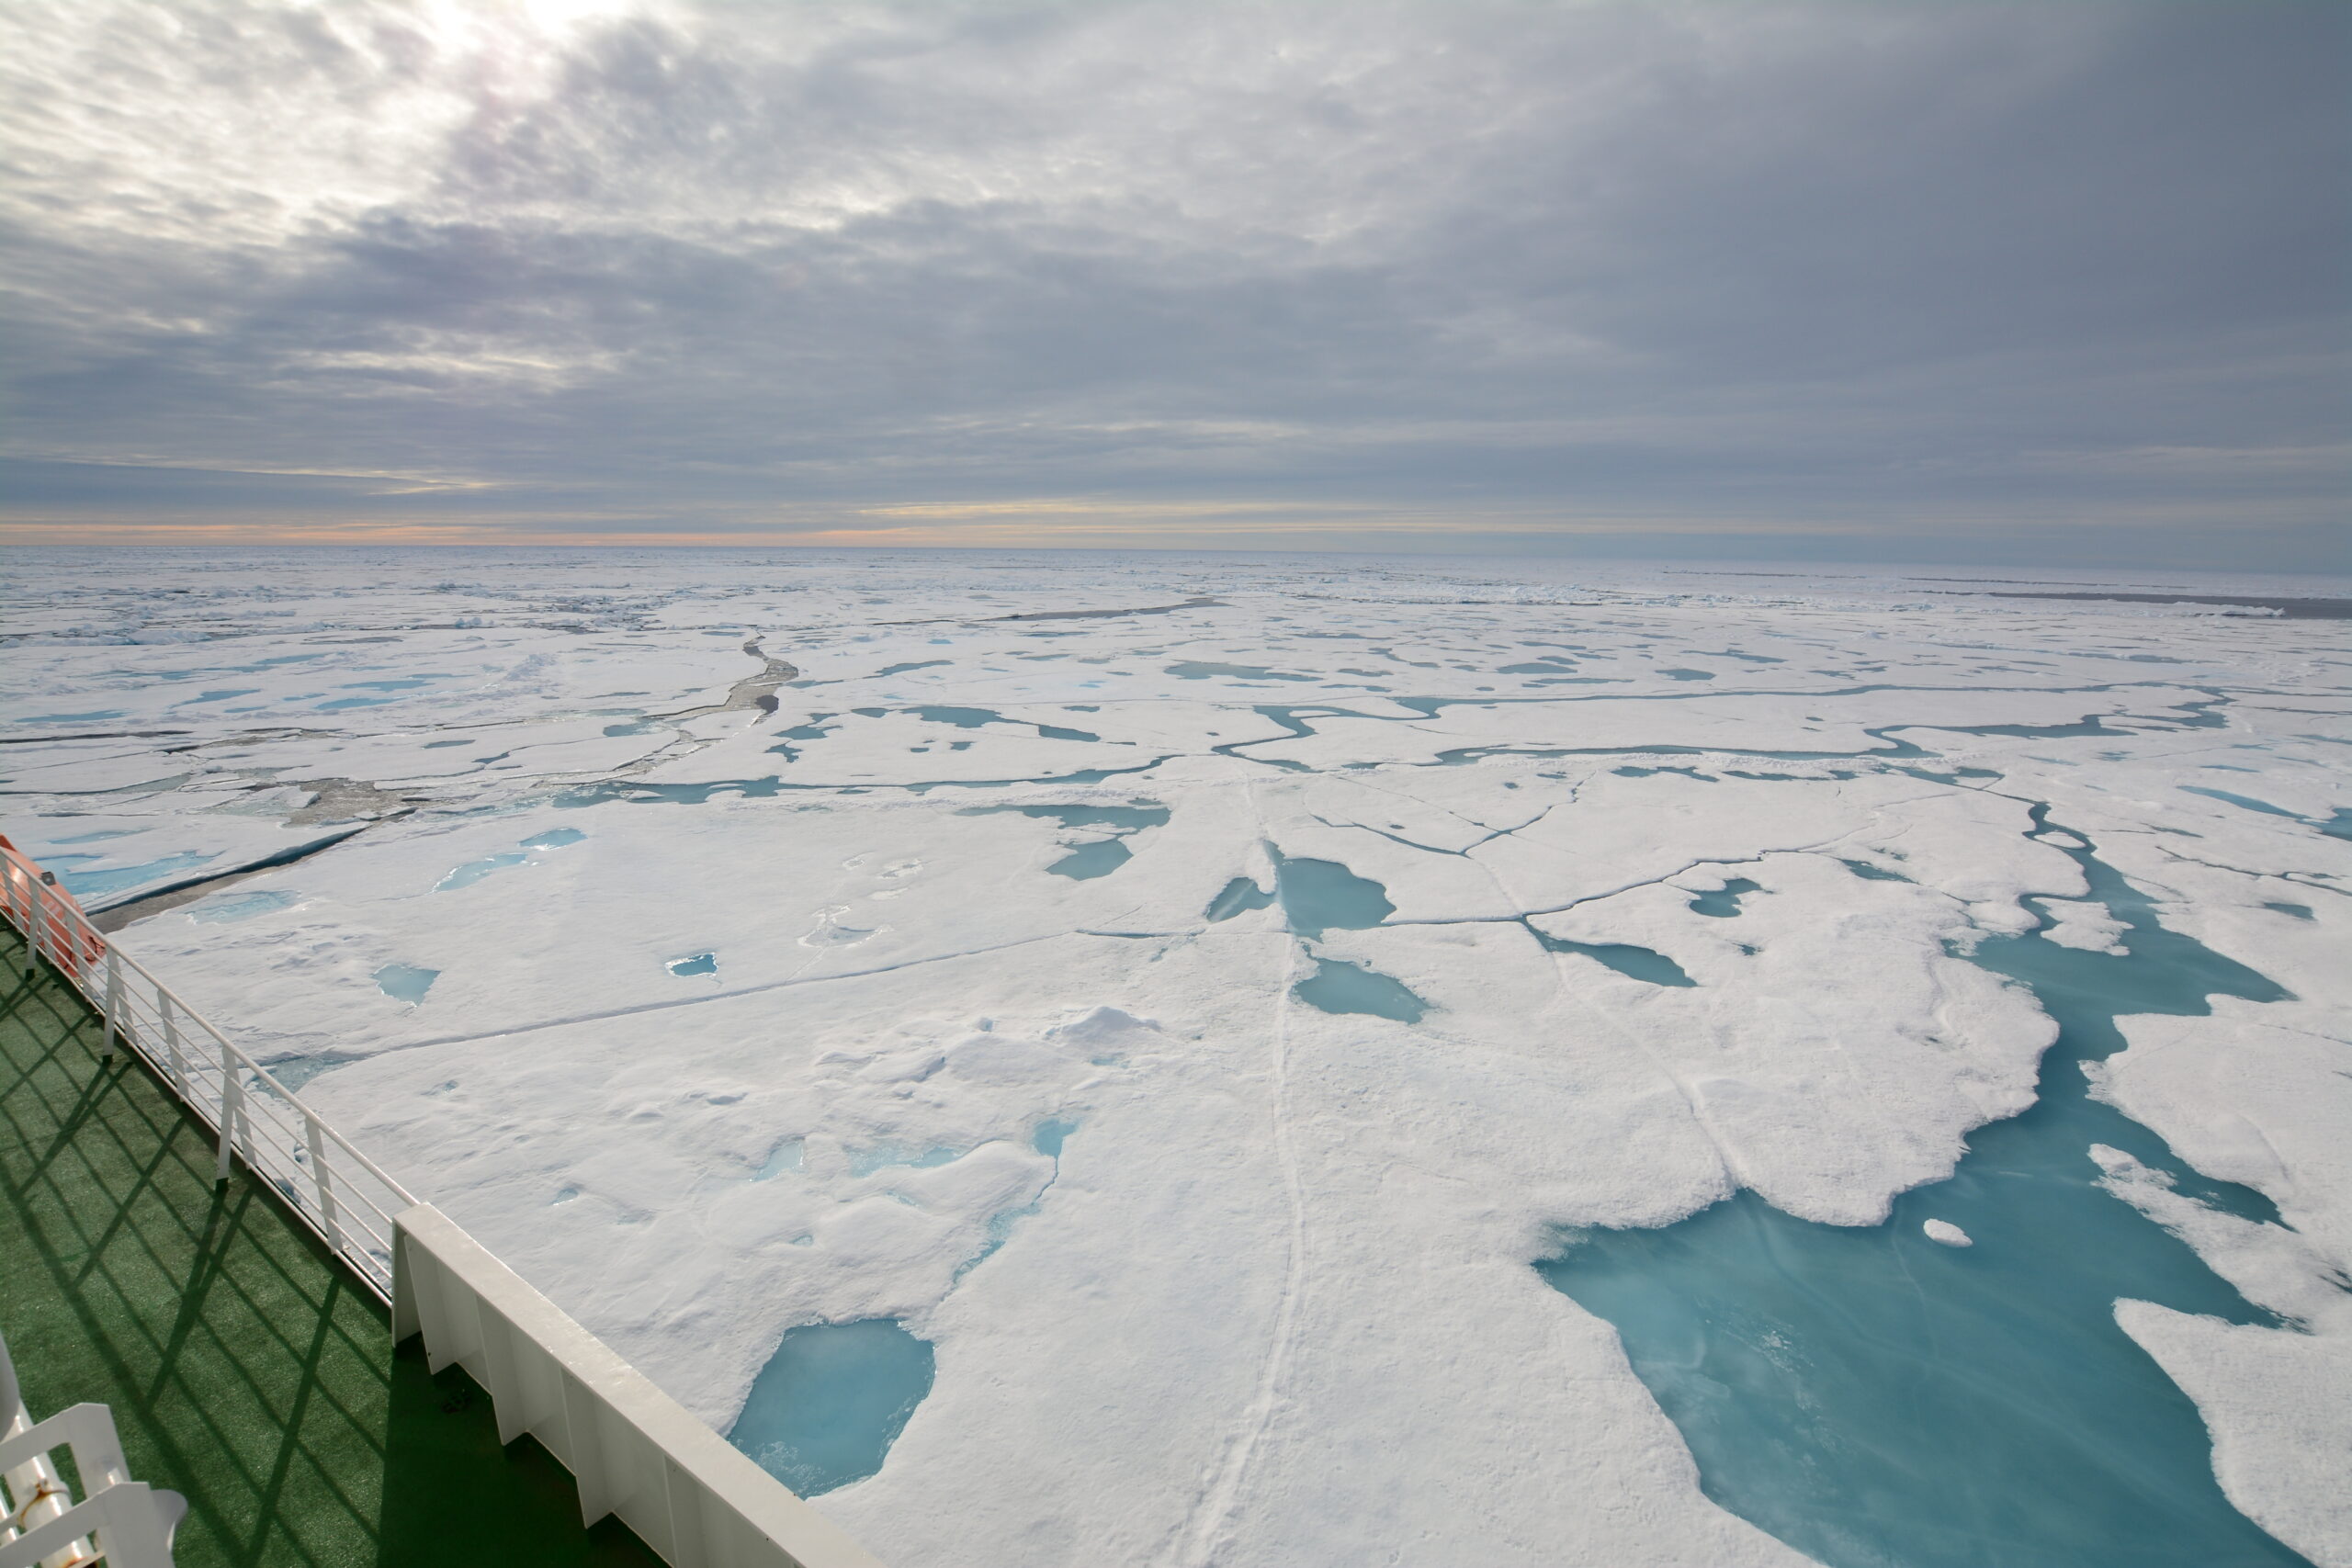
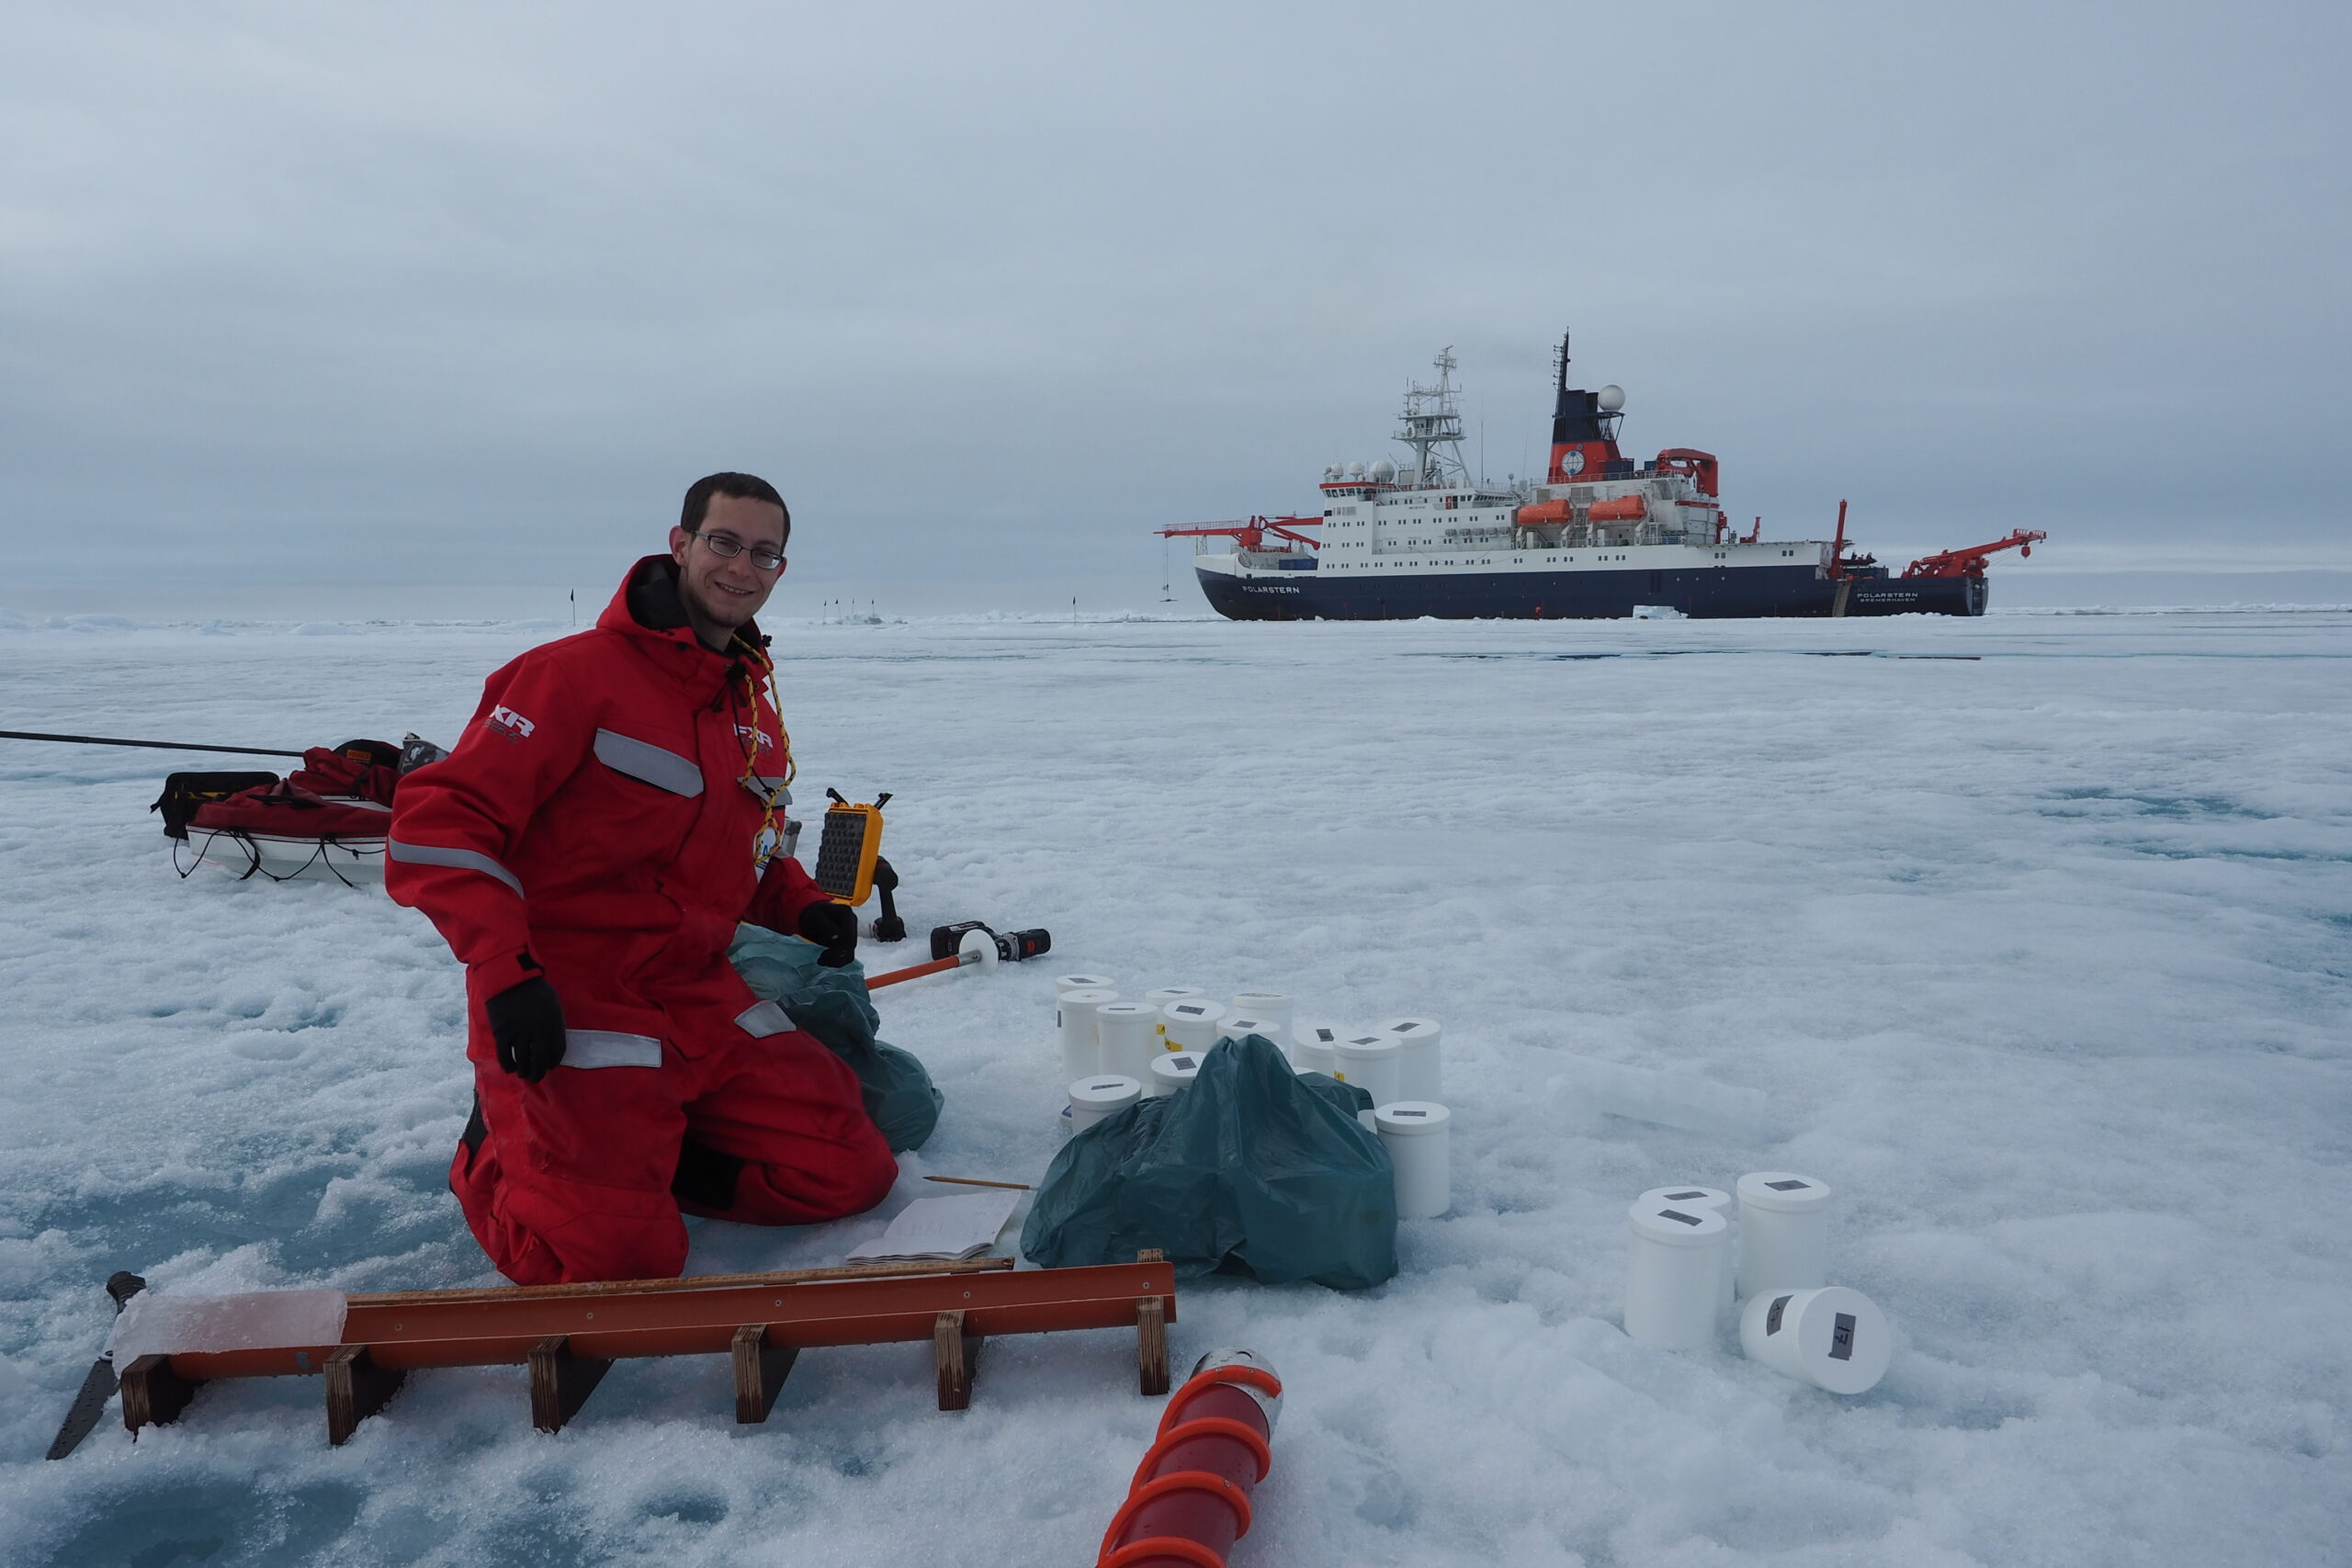
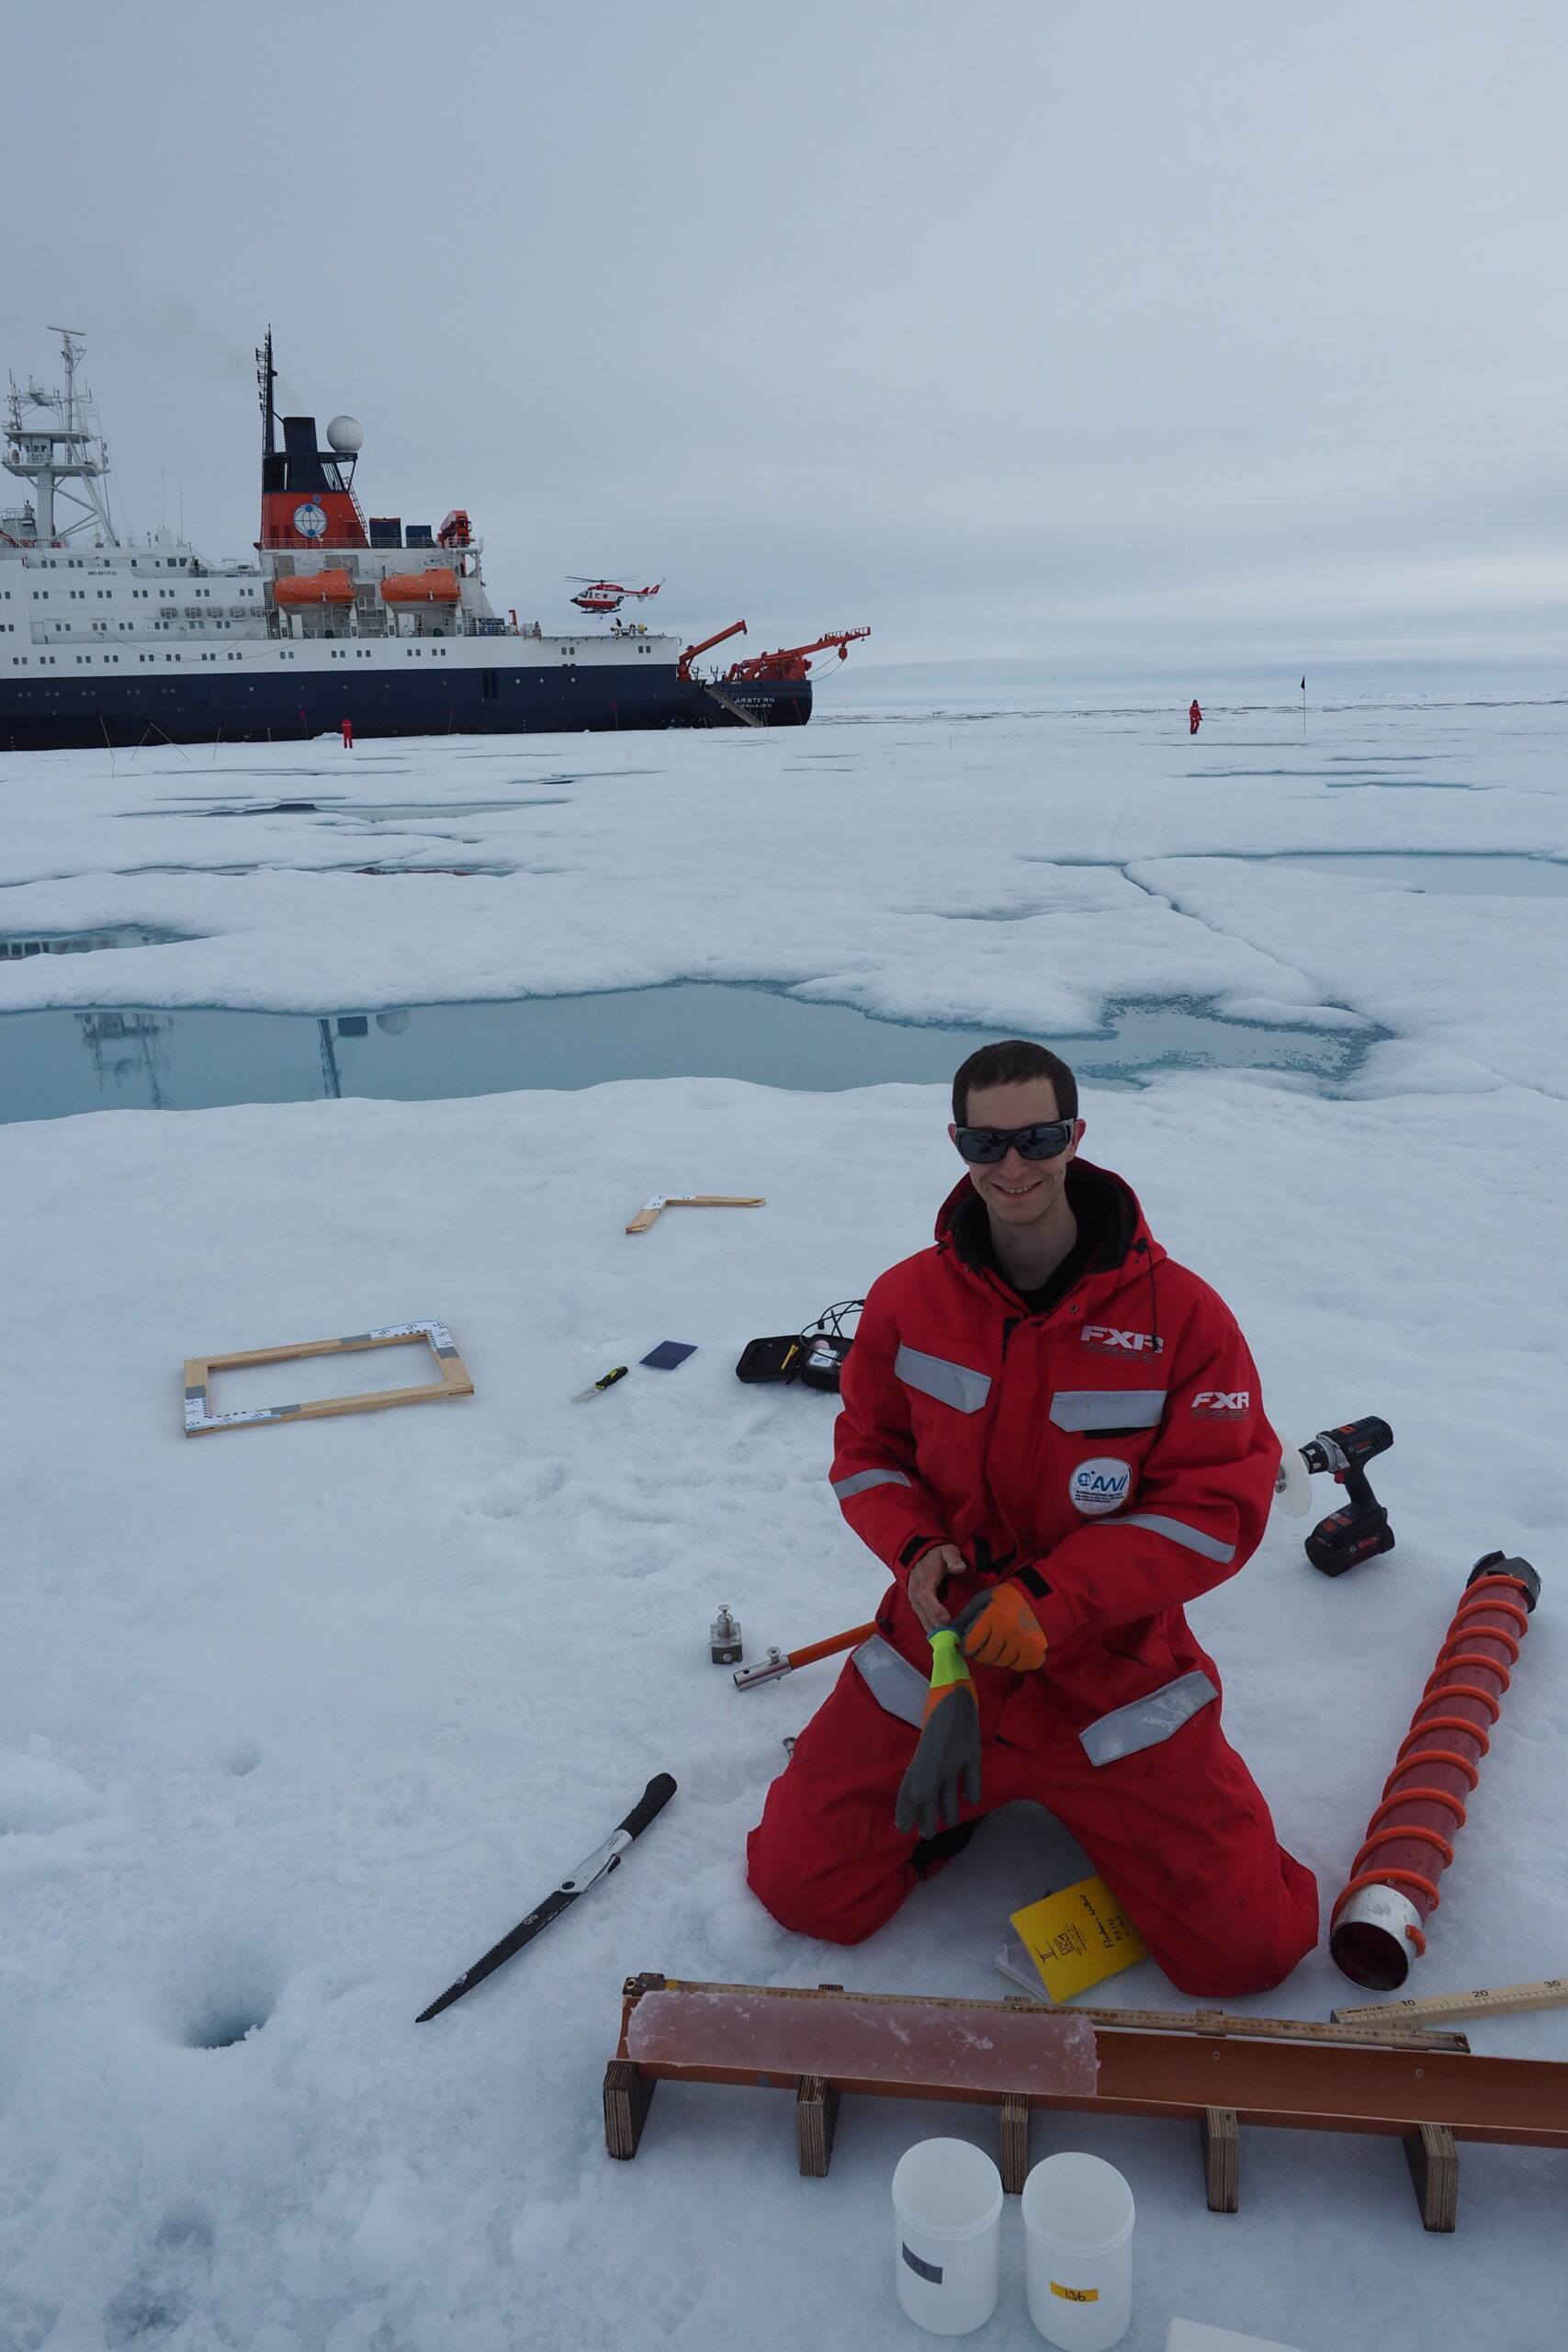
Polarstern cruise PS131 (ATWAICE) was a multidisciplinary expedition to investigate sea ice melting processes in the warming Arctic, ocean currents affecting nutrient supply for flora and fauna, ocean impacts on the melt of glaciers at Greenland’s east coast, and to deploy seismometers at the Aurora Vent Field. The expedition started on 28th June 2022 in Bremerhaven and led us to the Fram Strait, the marginal sea ice zone north-west of Svalbard, to fast ice at the east coast of Greenland and to Scoresby Sund, before returning to Bremerhaven on 17th August 2022.
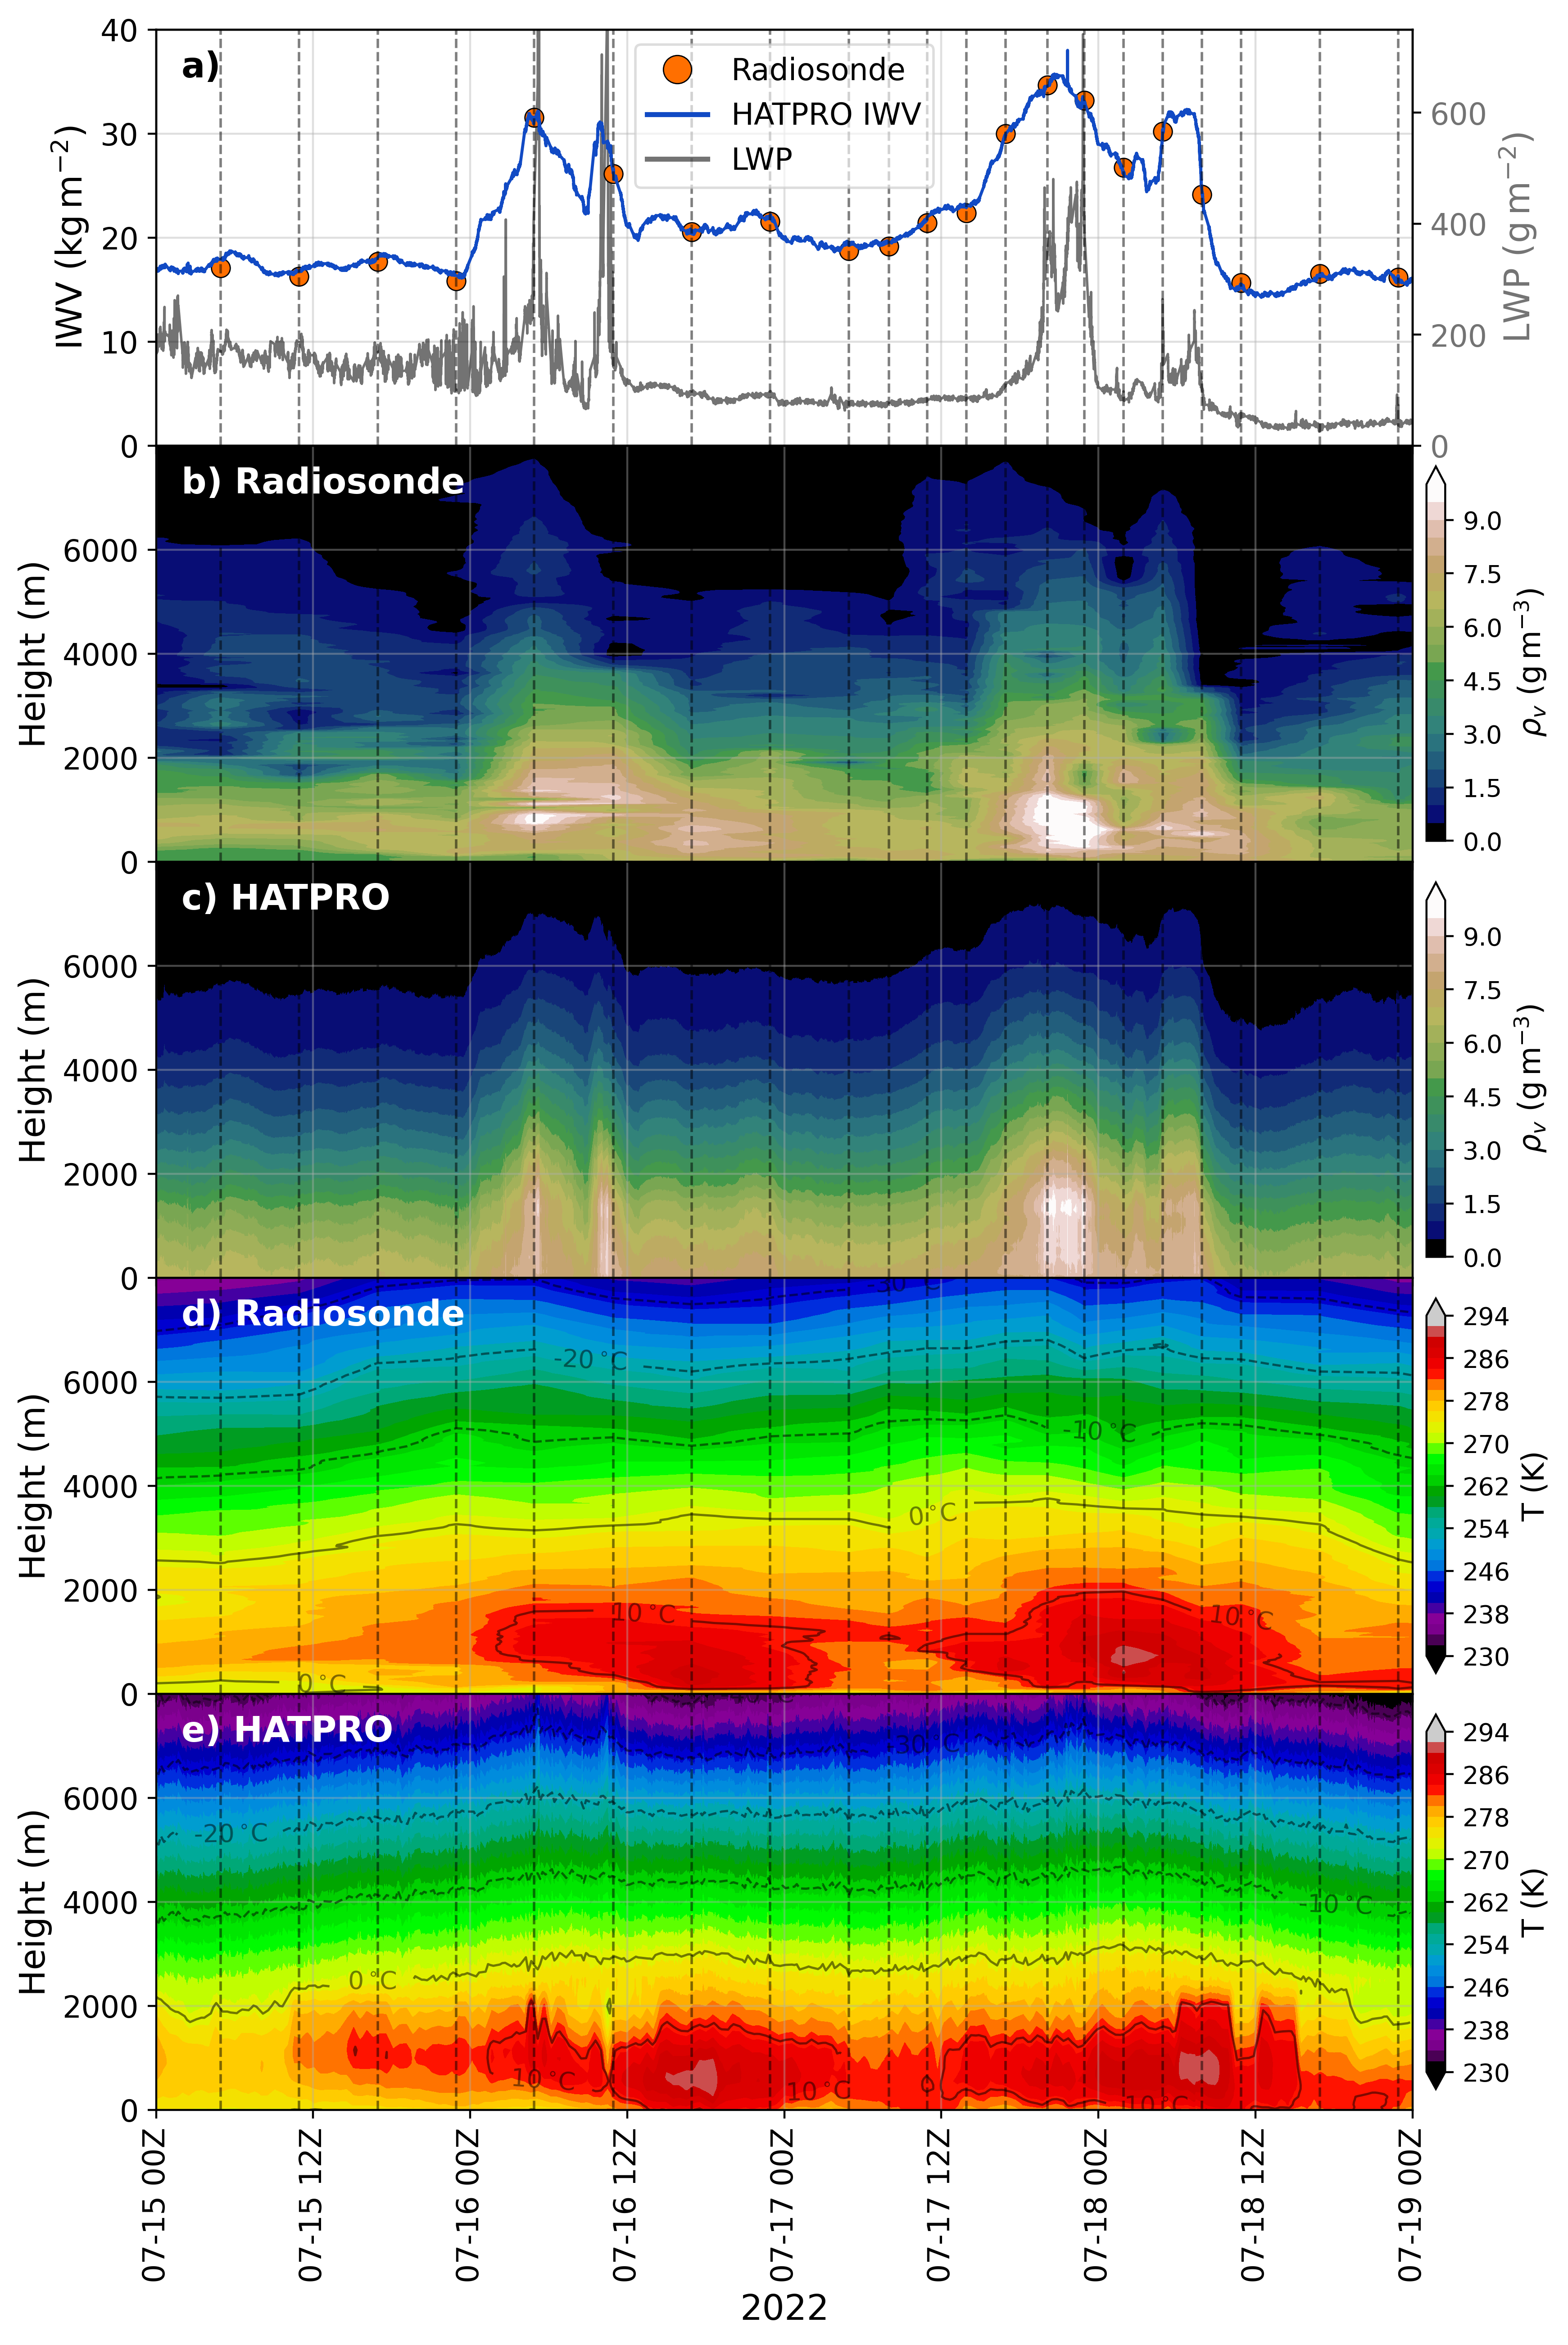
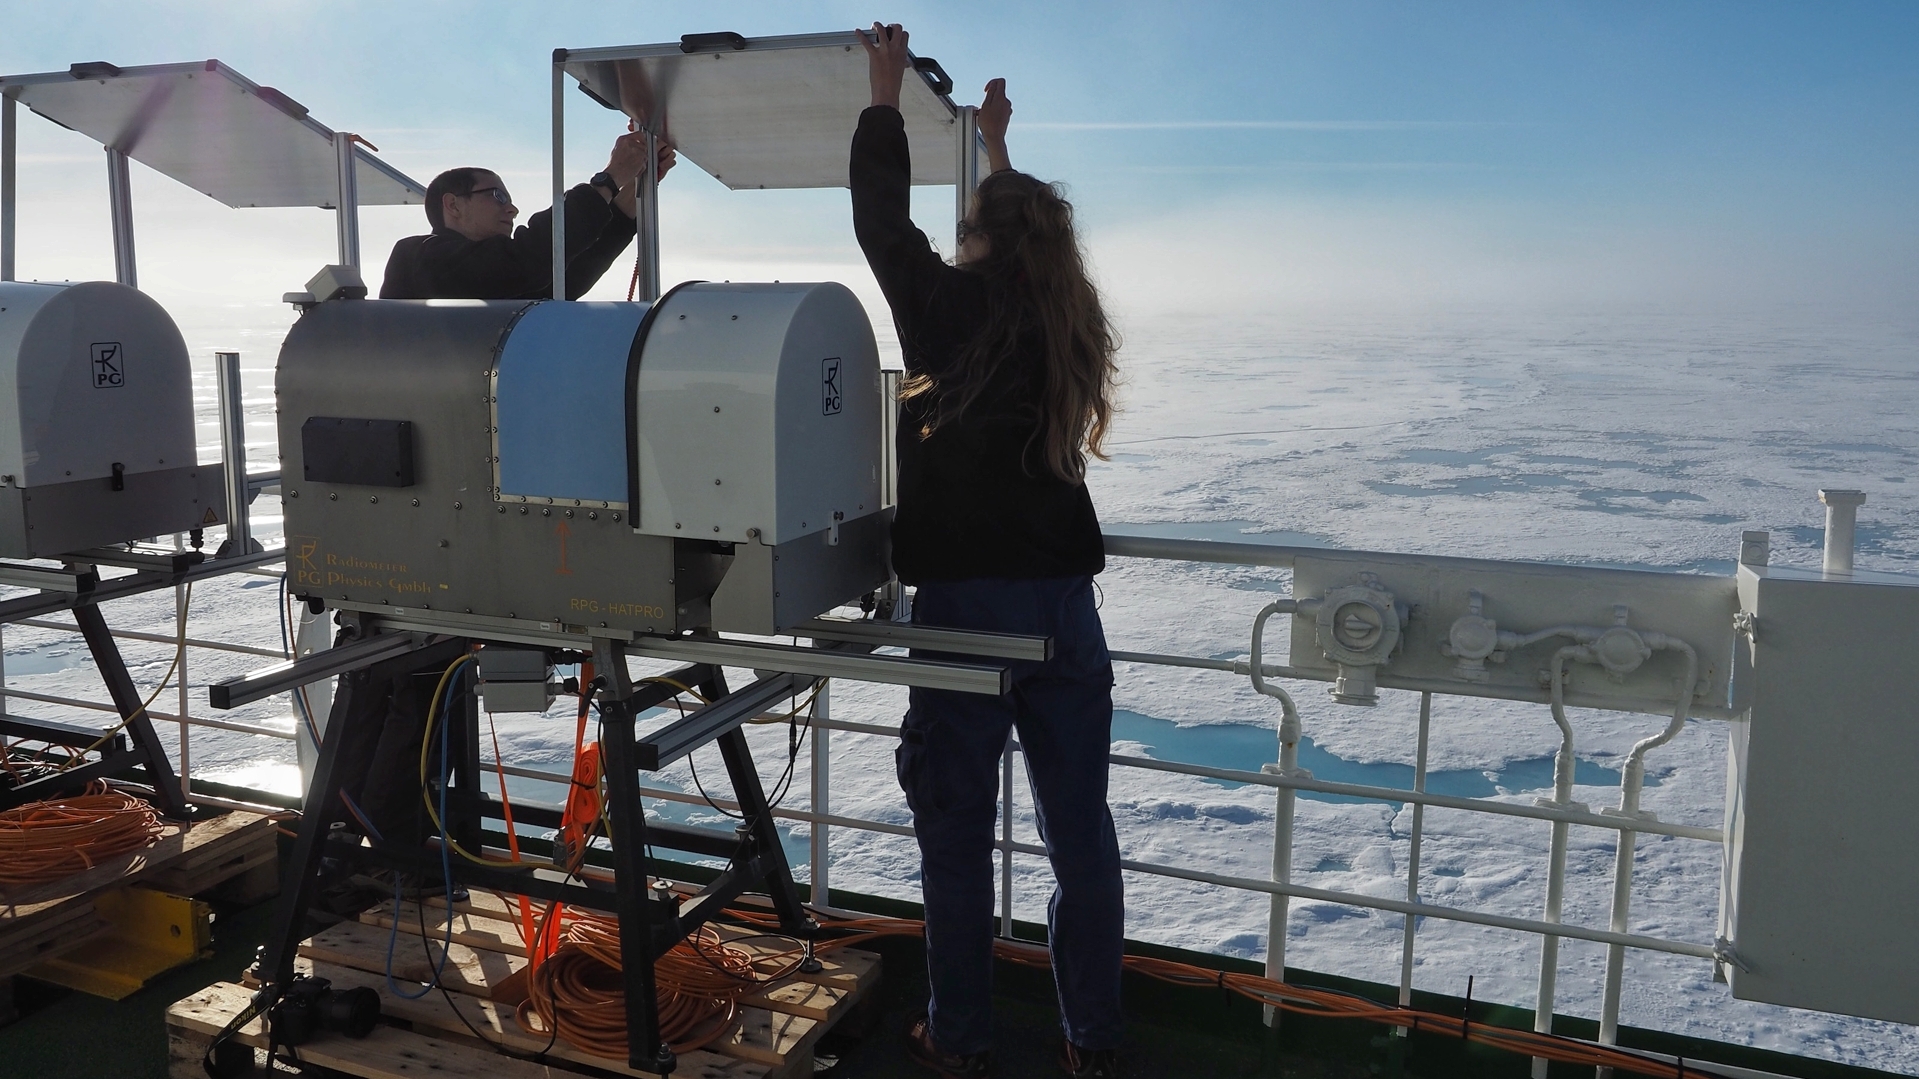
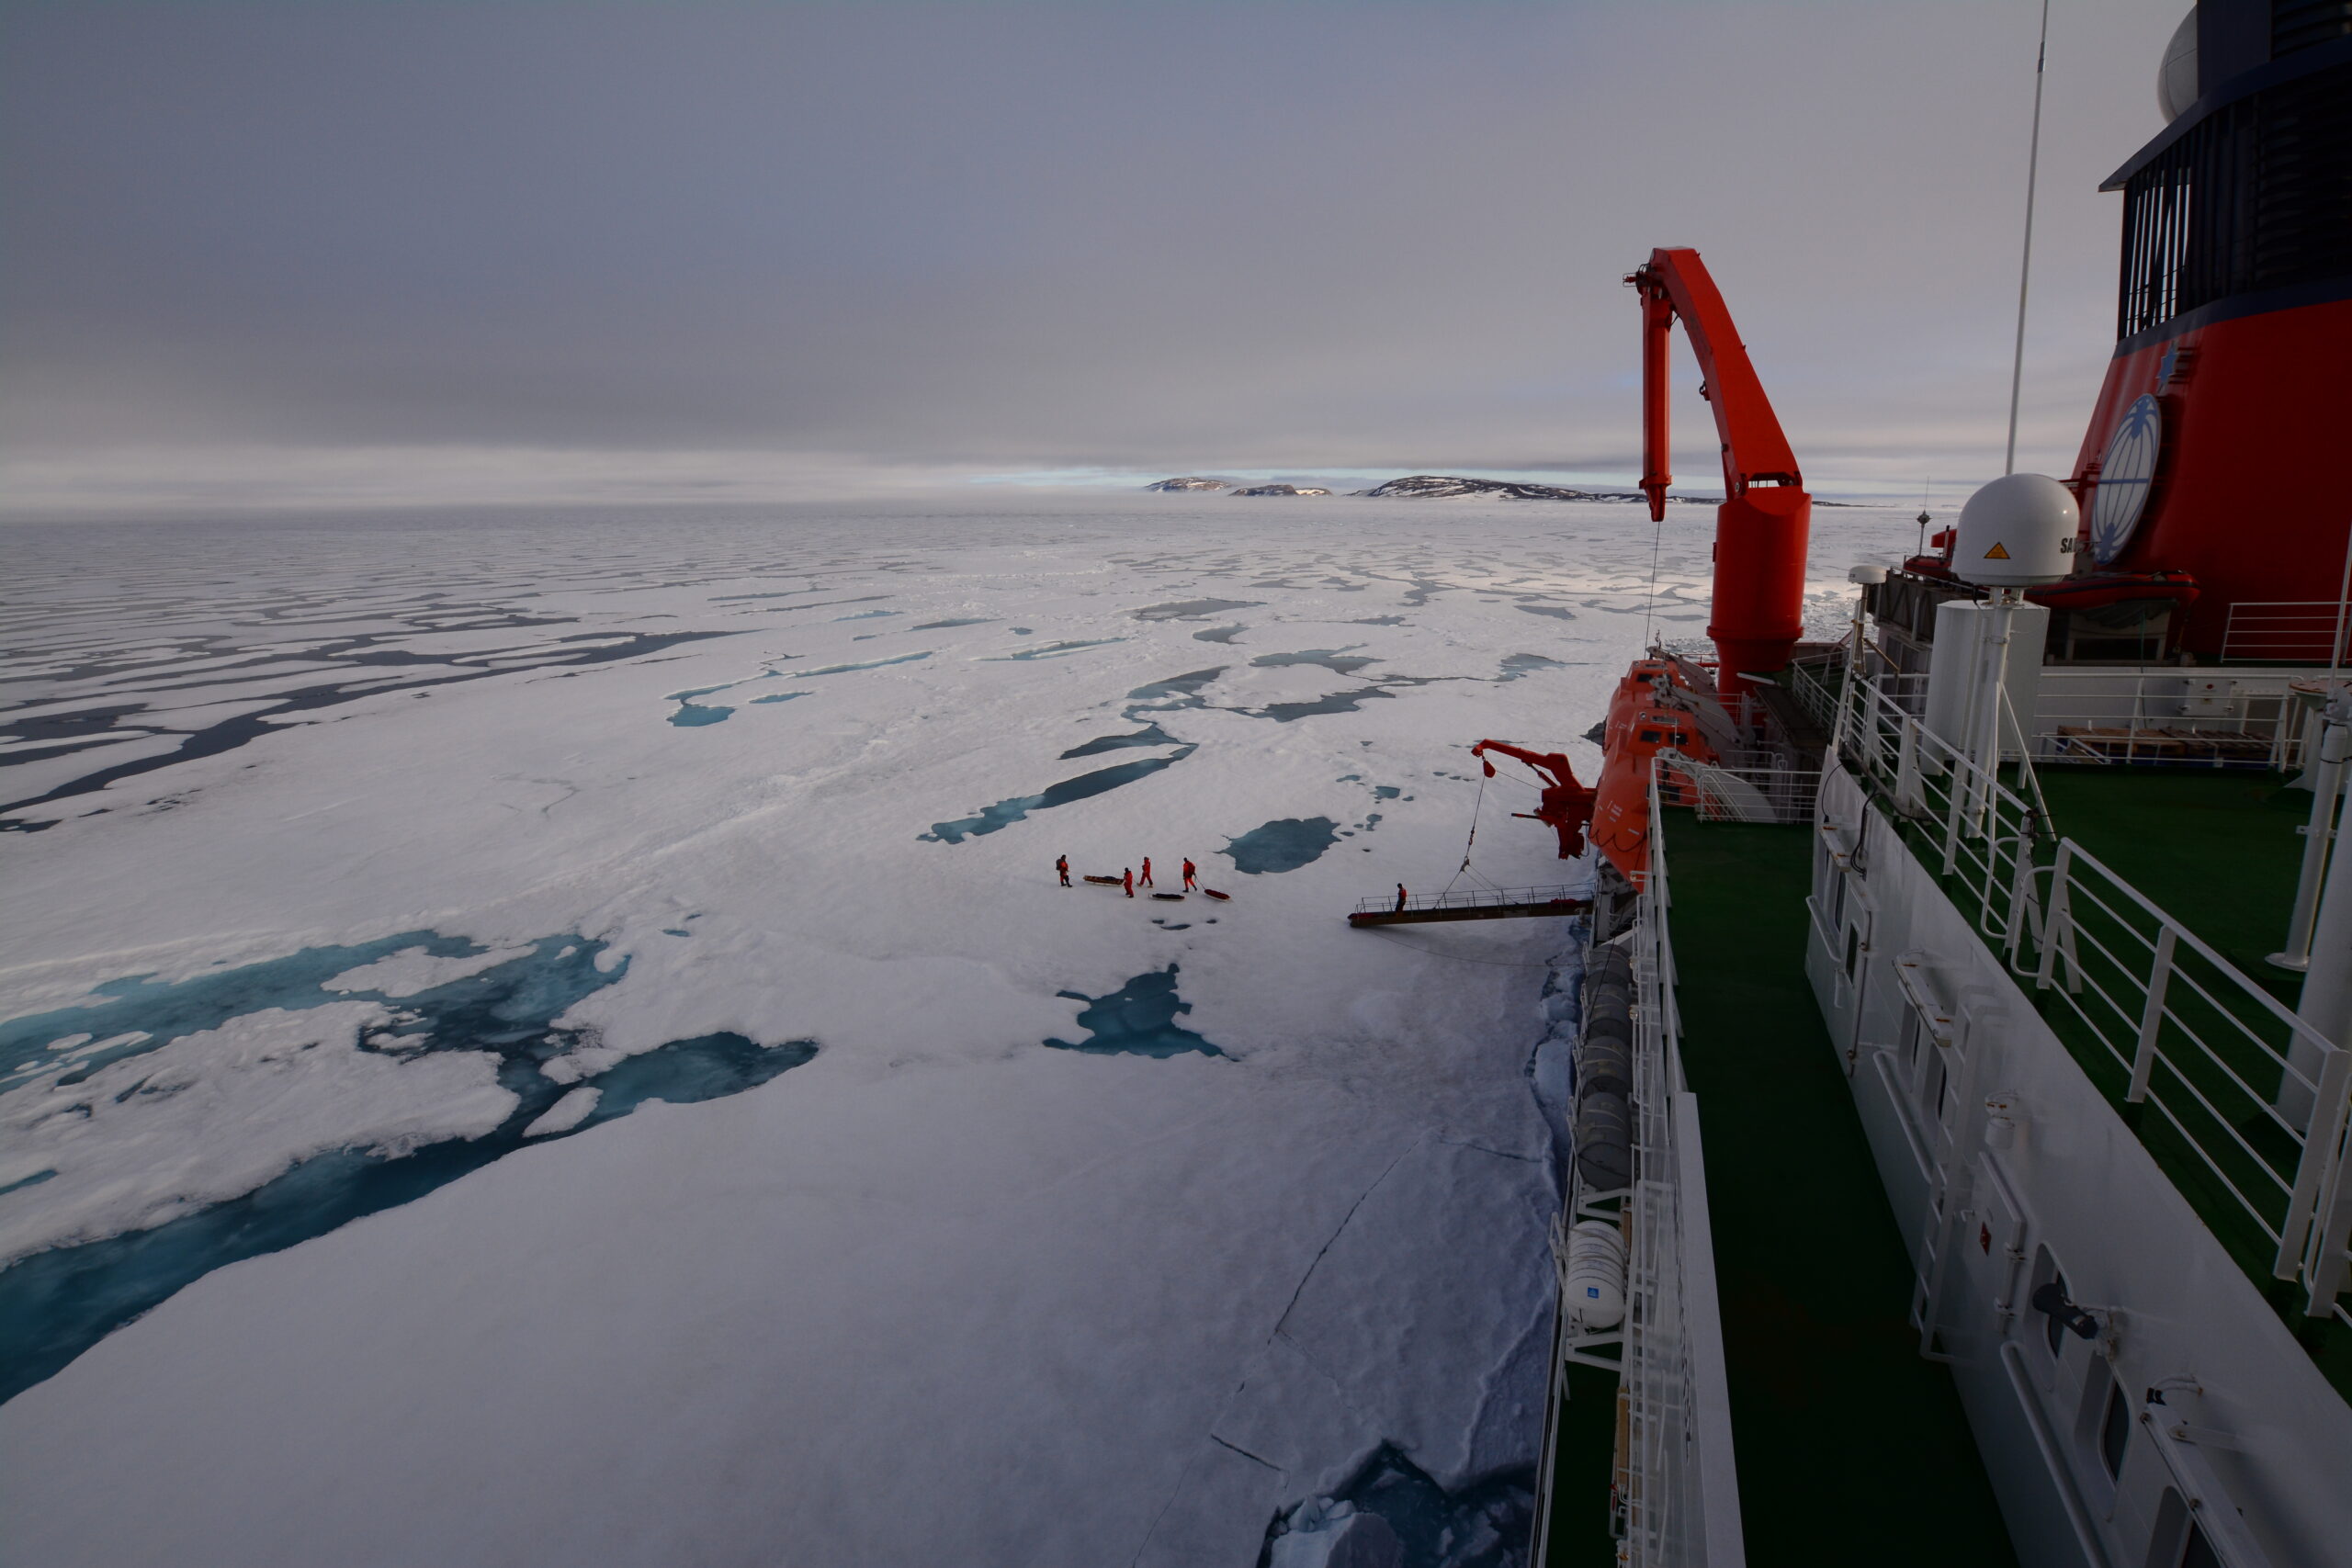
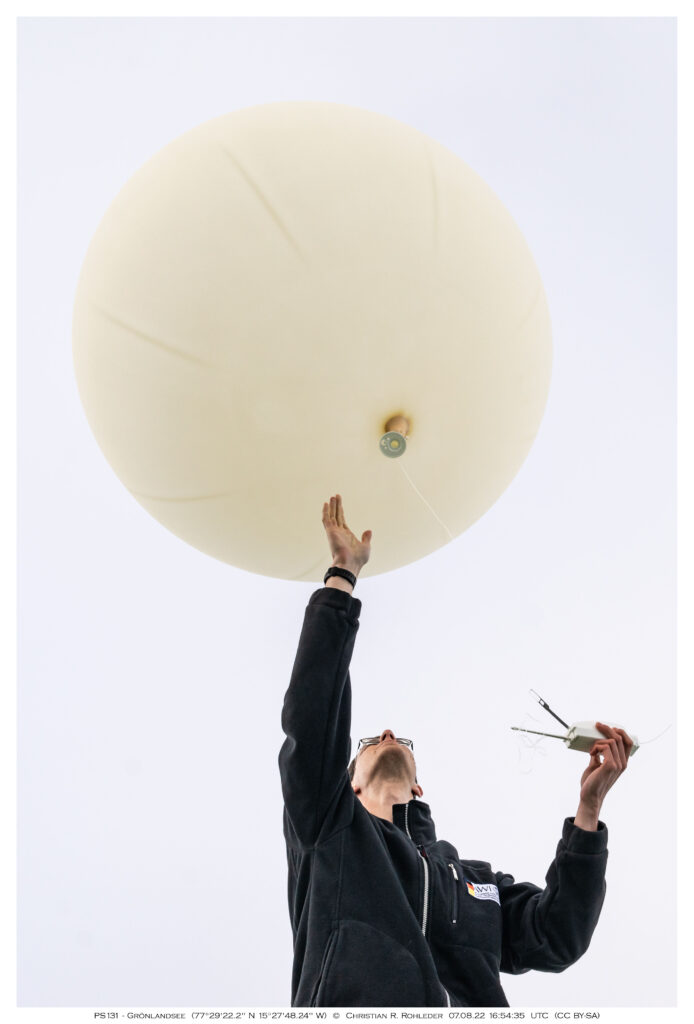
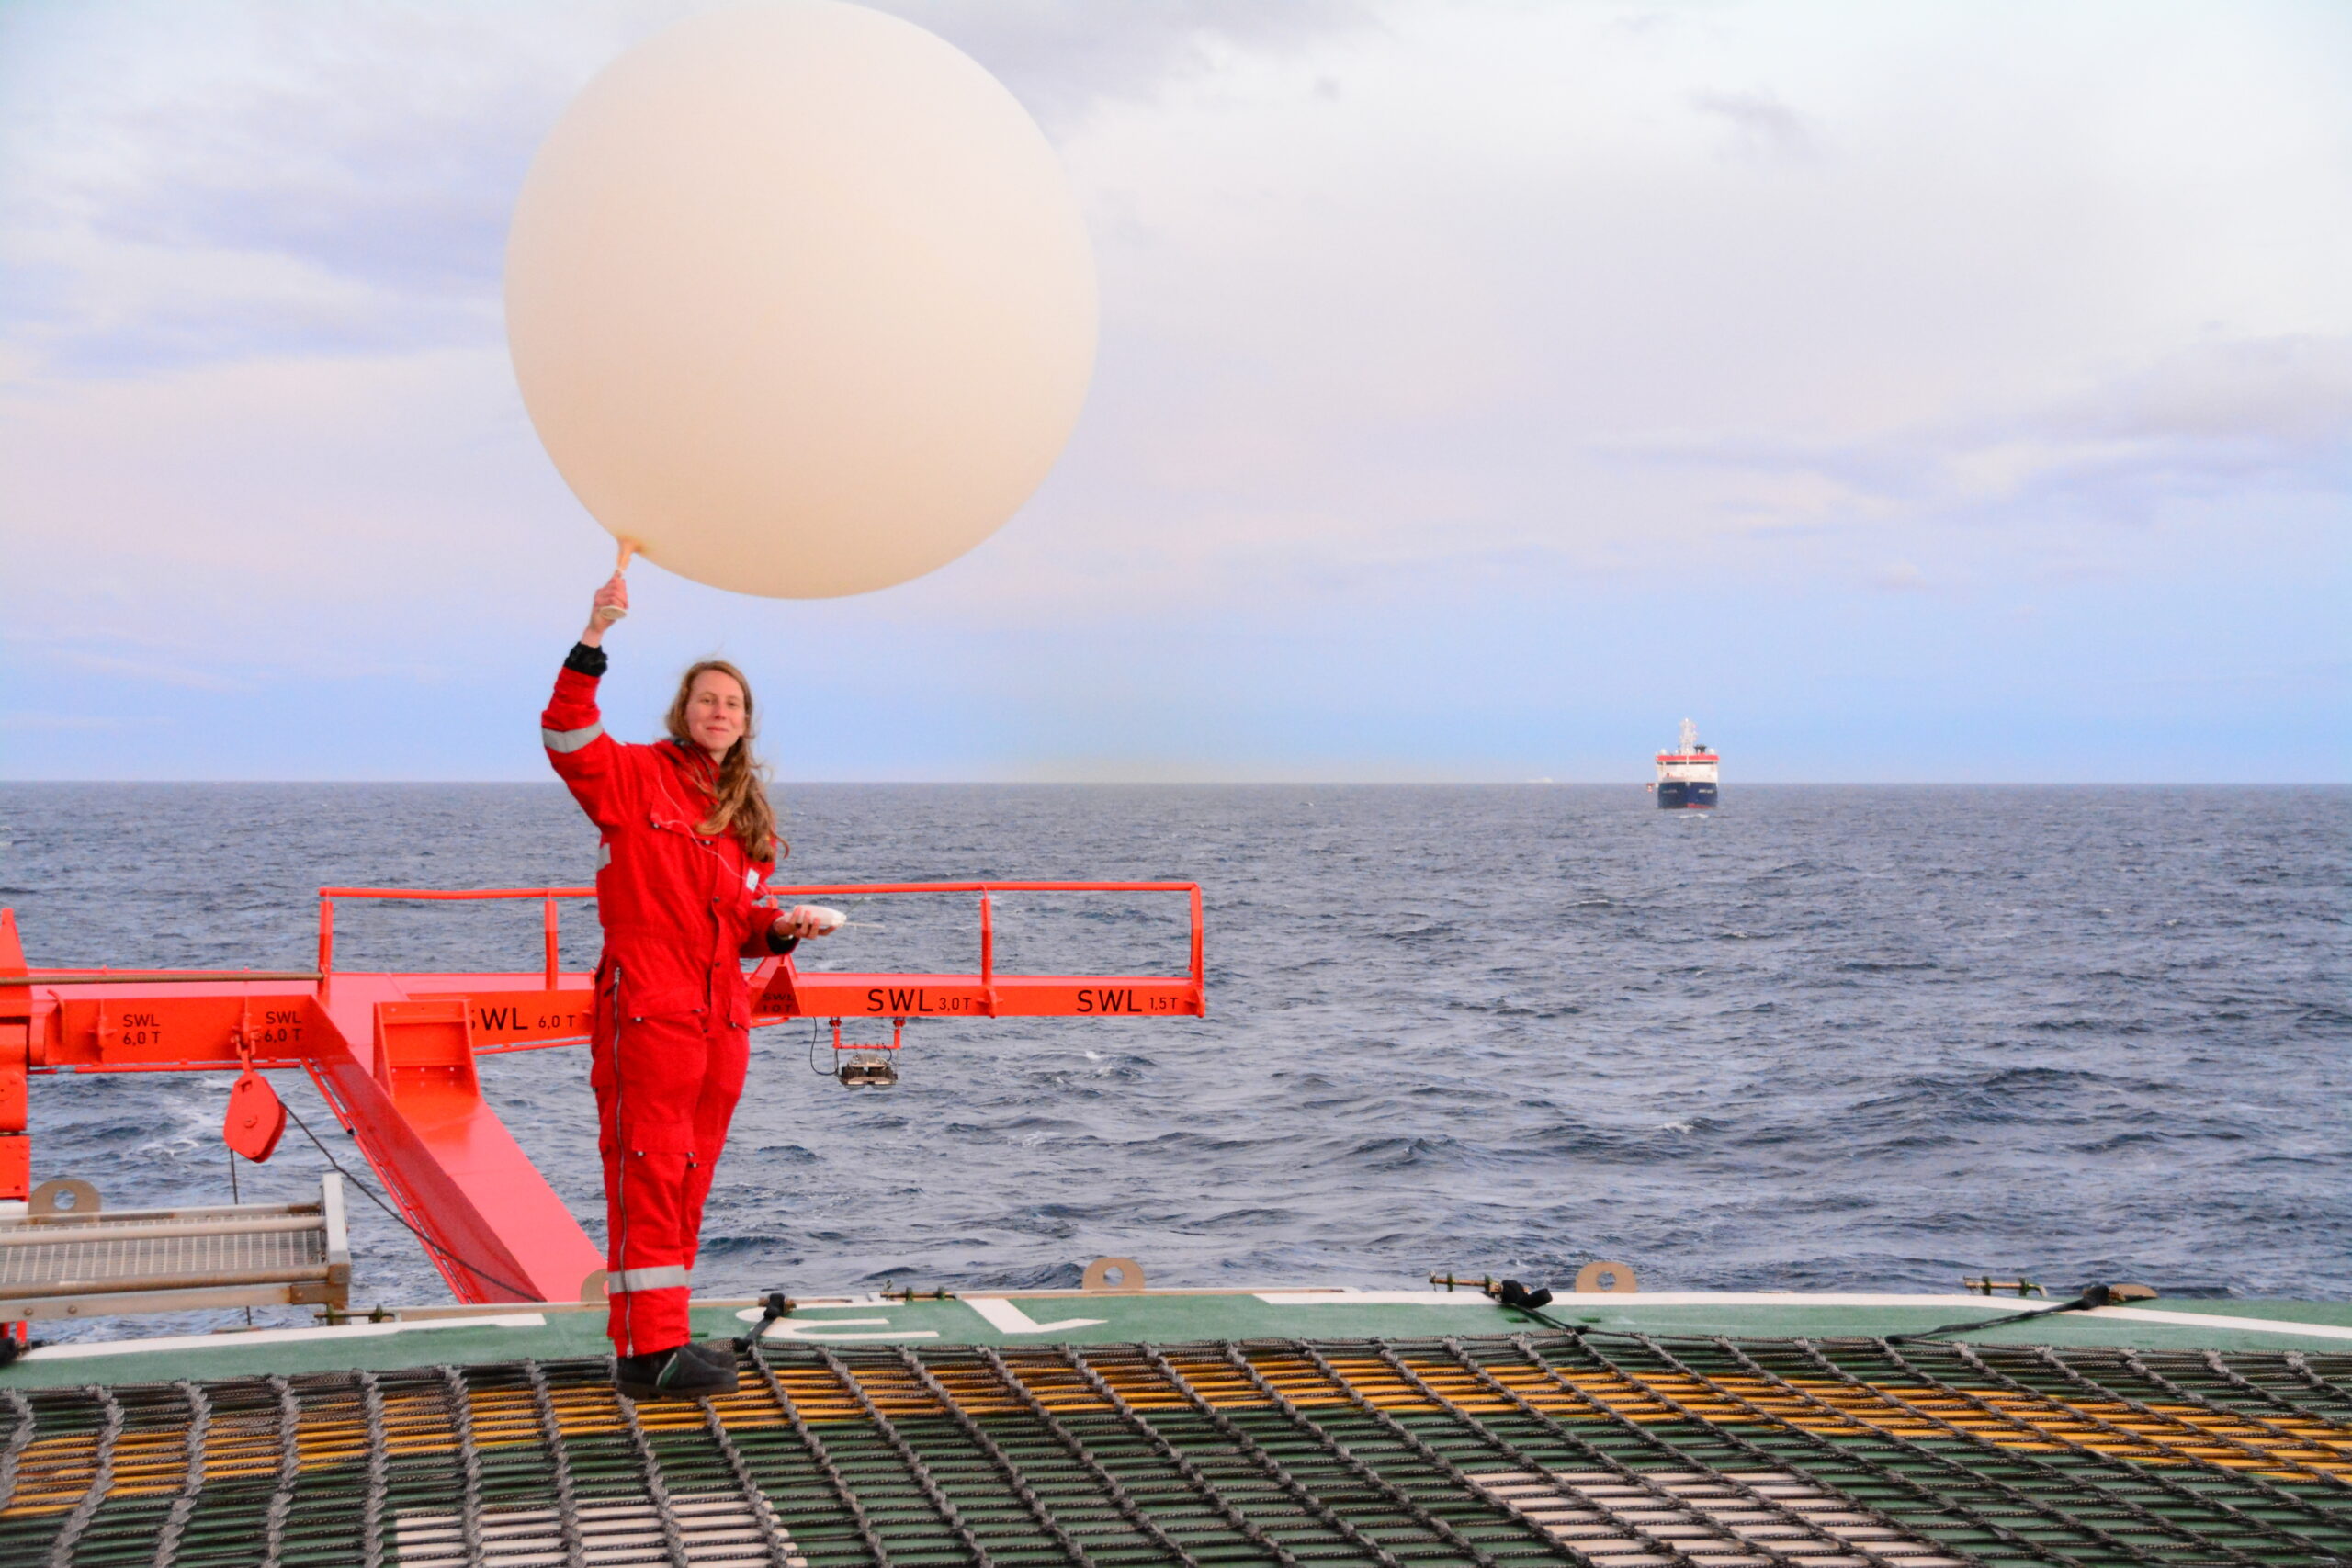
Our working group also joined the expedition with atmospheric measurements using microwave radiometers (HATPRO and MiRAC-P) and radiosondes (weather balloons). The microwave radiometers faced the sky and primarily measured radiation emitted by the atmosphere (oxygen, water vapor, and liquid droplets). An additional sky camera consisting of a GoPro Hero 10 Black and an infrared sensor was mounted next to the radiometers on the guard rail of Polarstern to give us information about the sky conditions. From the HATPRO data, we could already retrieve preliminary temperature and humidity profiles, as well as the total amount of water vapor (known as Integrated Water Vapour or IWV) and cloud liquid water path (LWP) with a high temporal resolution (1 second). Complementary to the radiometers, radiosondes give us high vertical but low temporal resolution of temperature and humidity profiles. An example of this is shown for an extraordinary warm and moist air intrusion event from 15th to 19th July 2022. IWV peaked at 35 kg m-2 (comparable to mid-latitude summer conditions), and the temperatures reached more than 18 °C at a few hundred meters altitude. With a mirror construction designed by Pavel Krobot and Rainer H.-Lind and attached to the radiometers, we could also directly observe the radiation emitted by the sea ice and ocean. These measurements will later be compared to skin temperature measurements of the sea ice taken by an infrared camera to estimate the sea ice emissivity. Another GoPro is also mounted on the infrared camera to provide a visual context of the sea ice conditions.
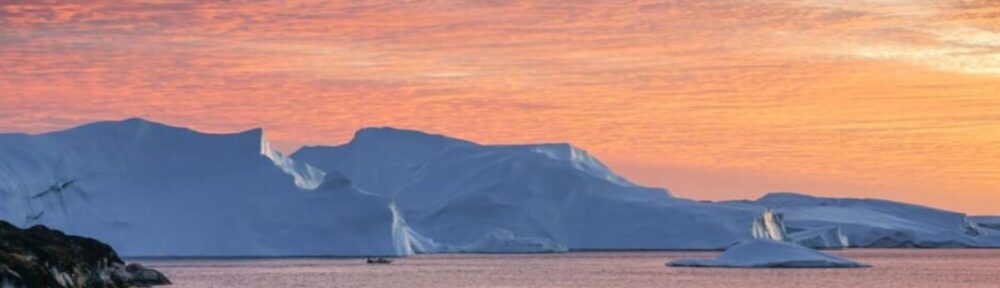
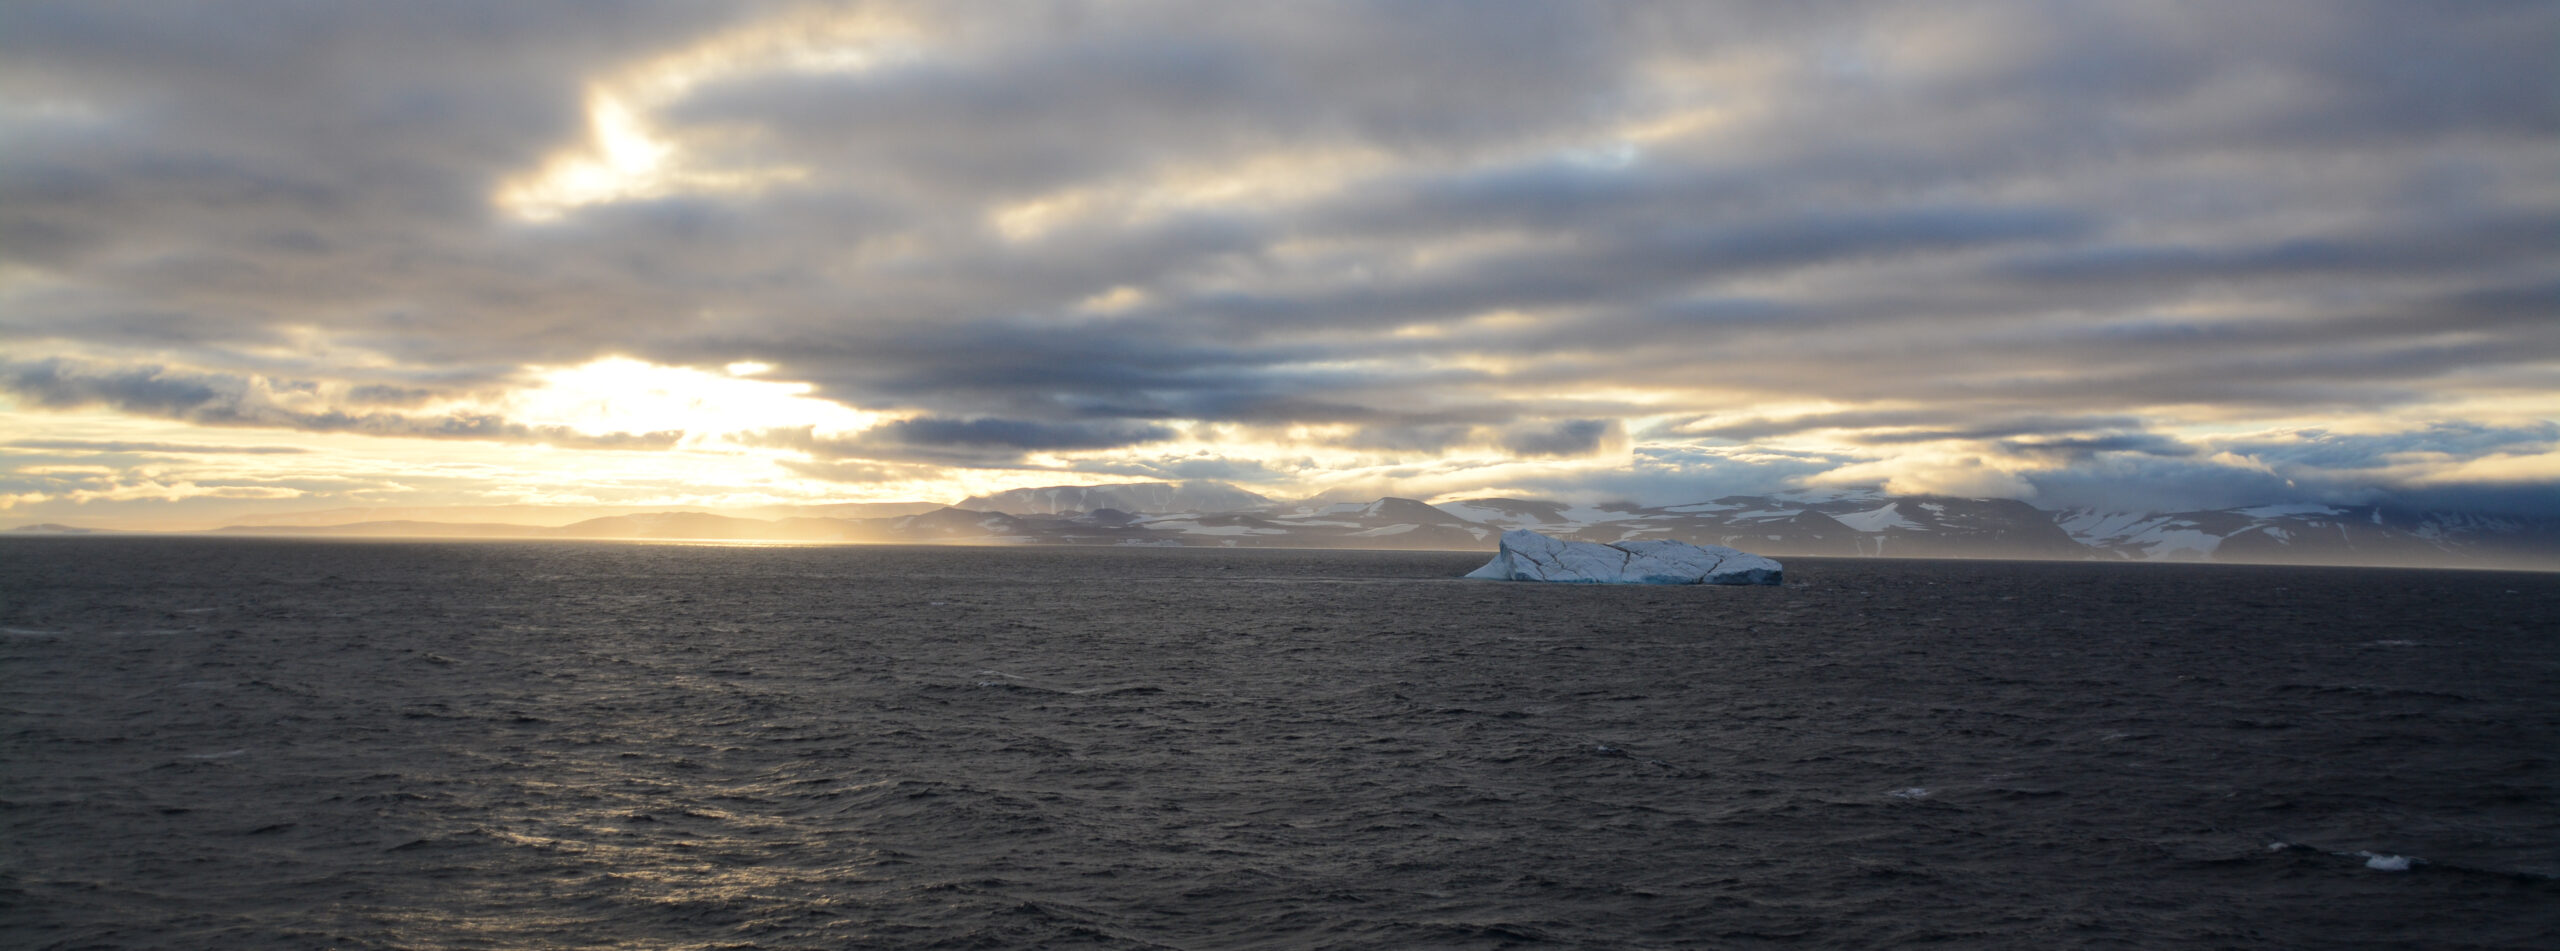
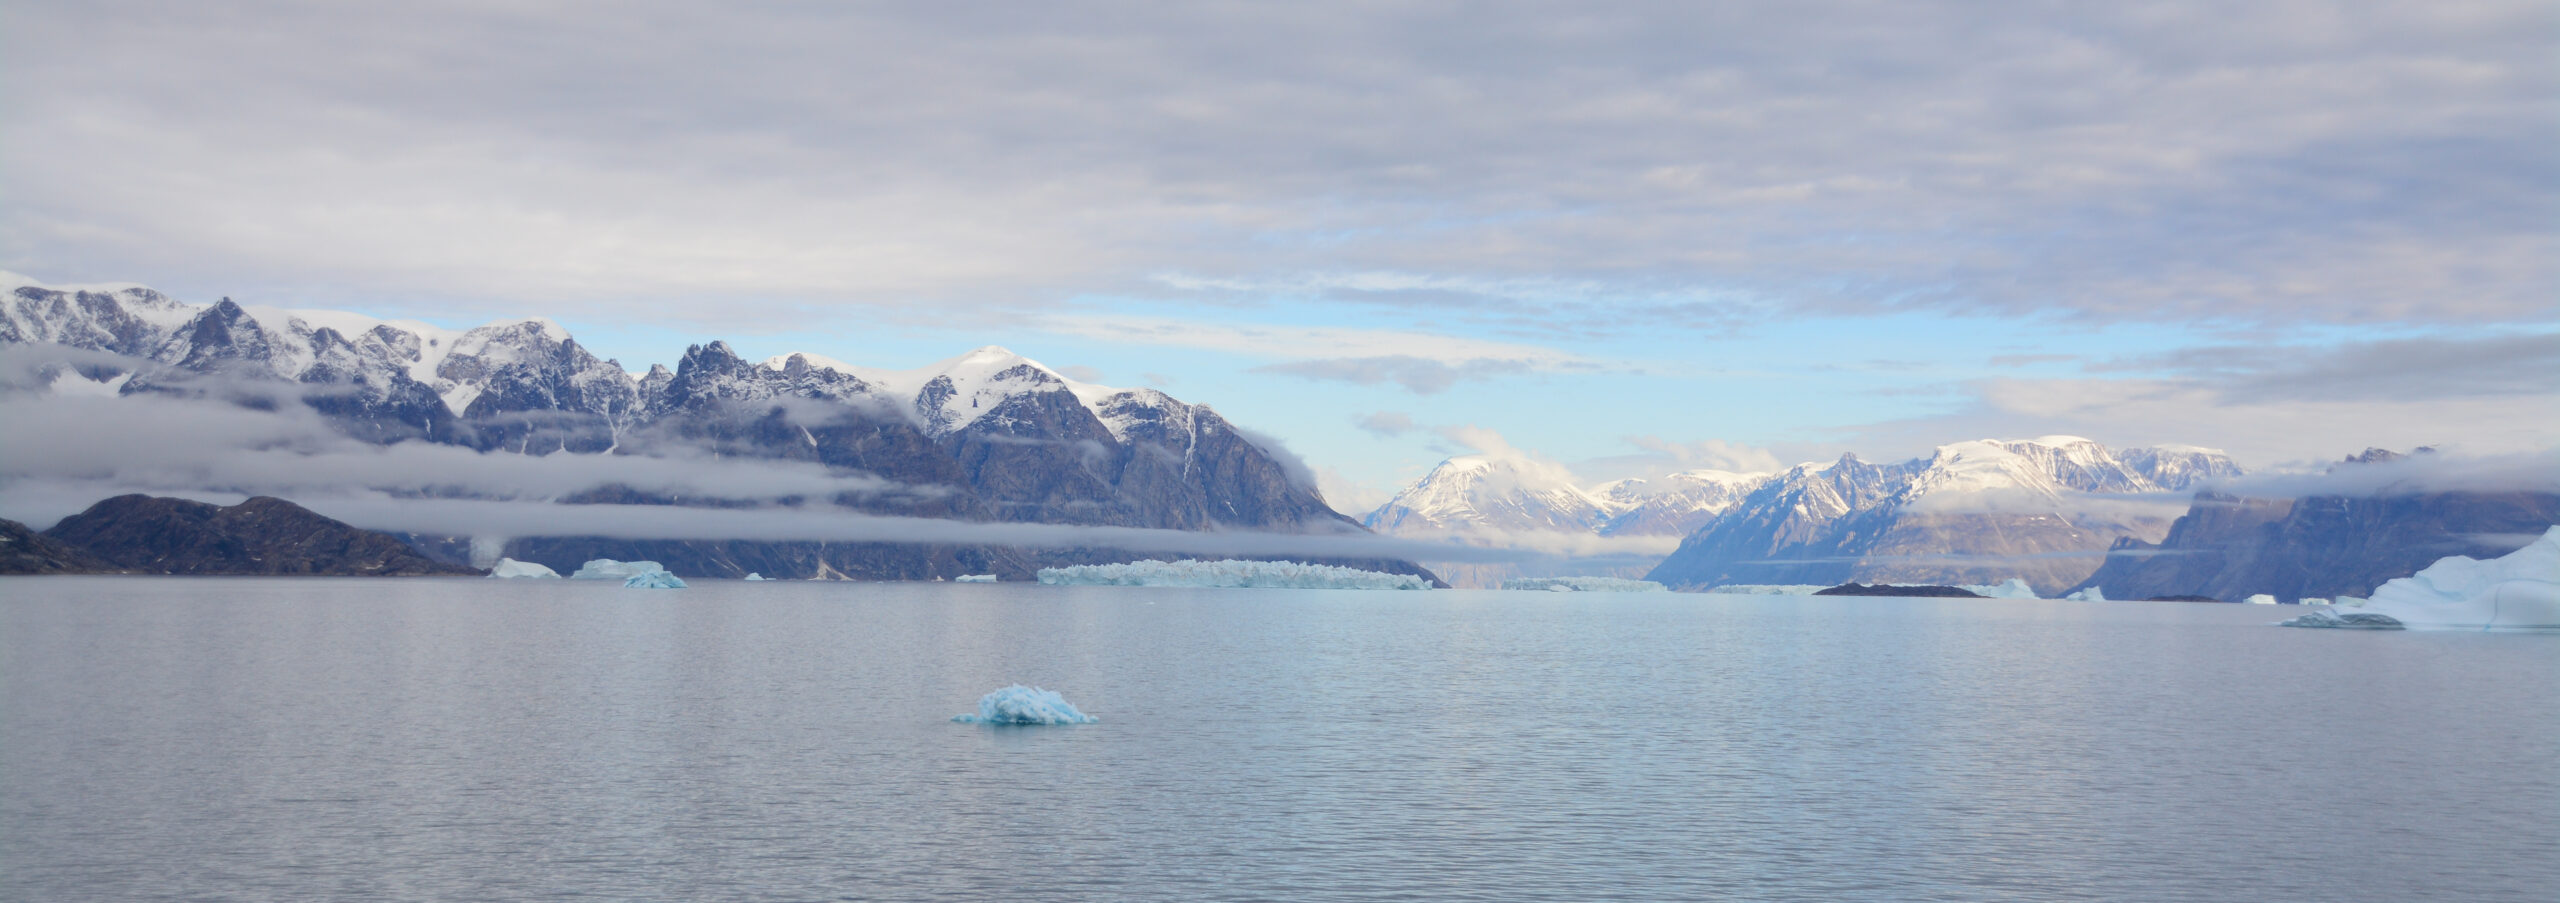
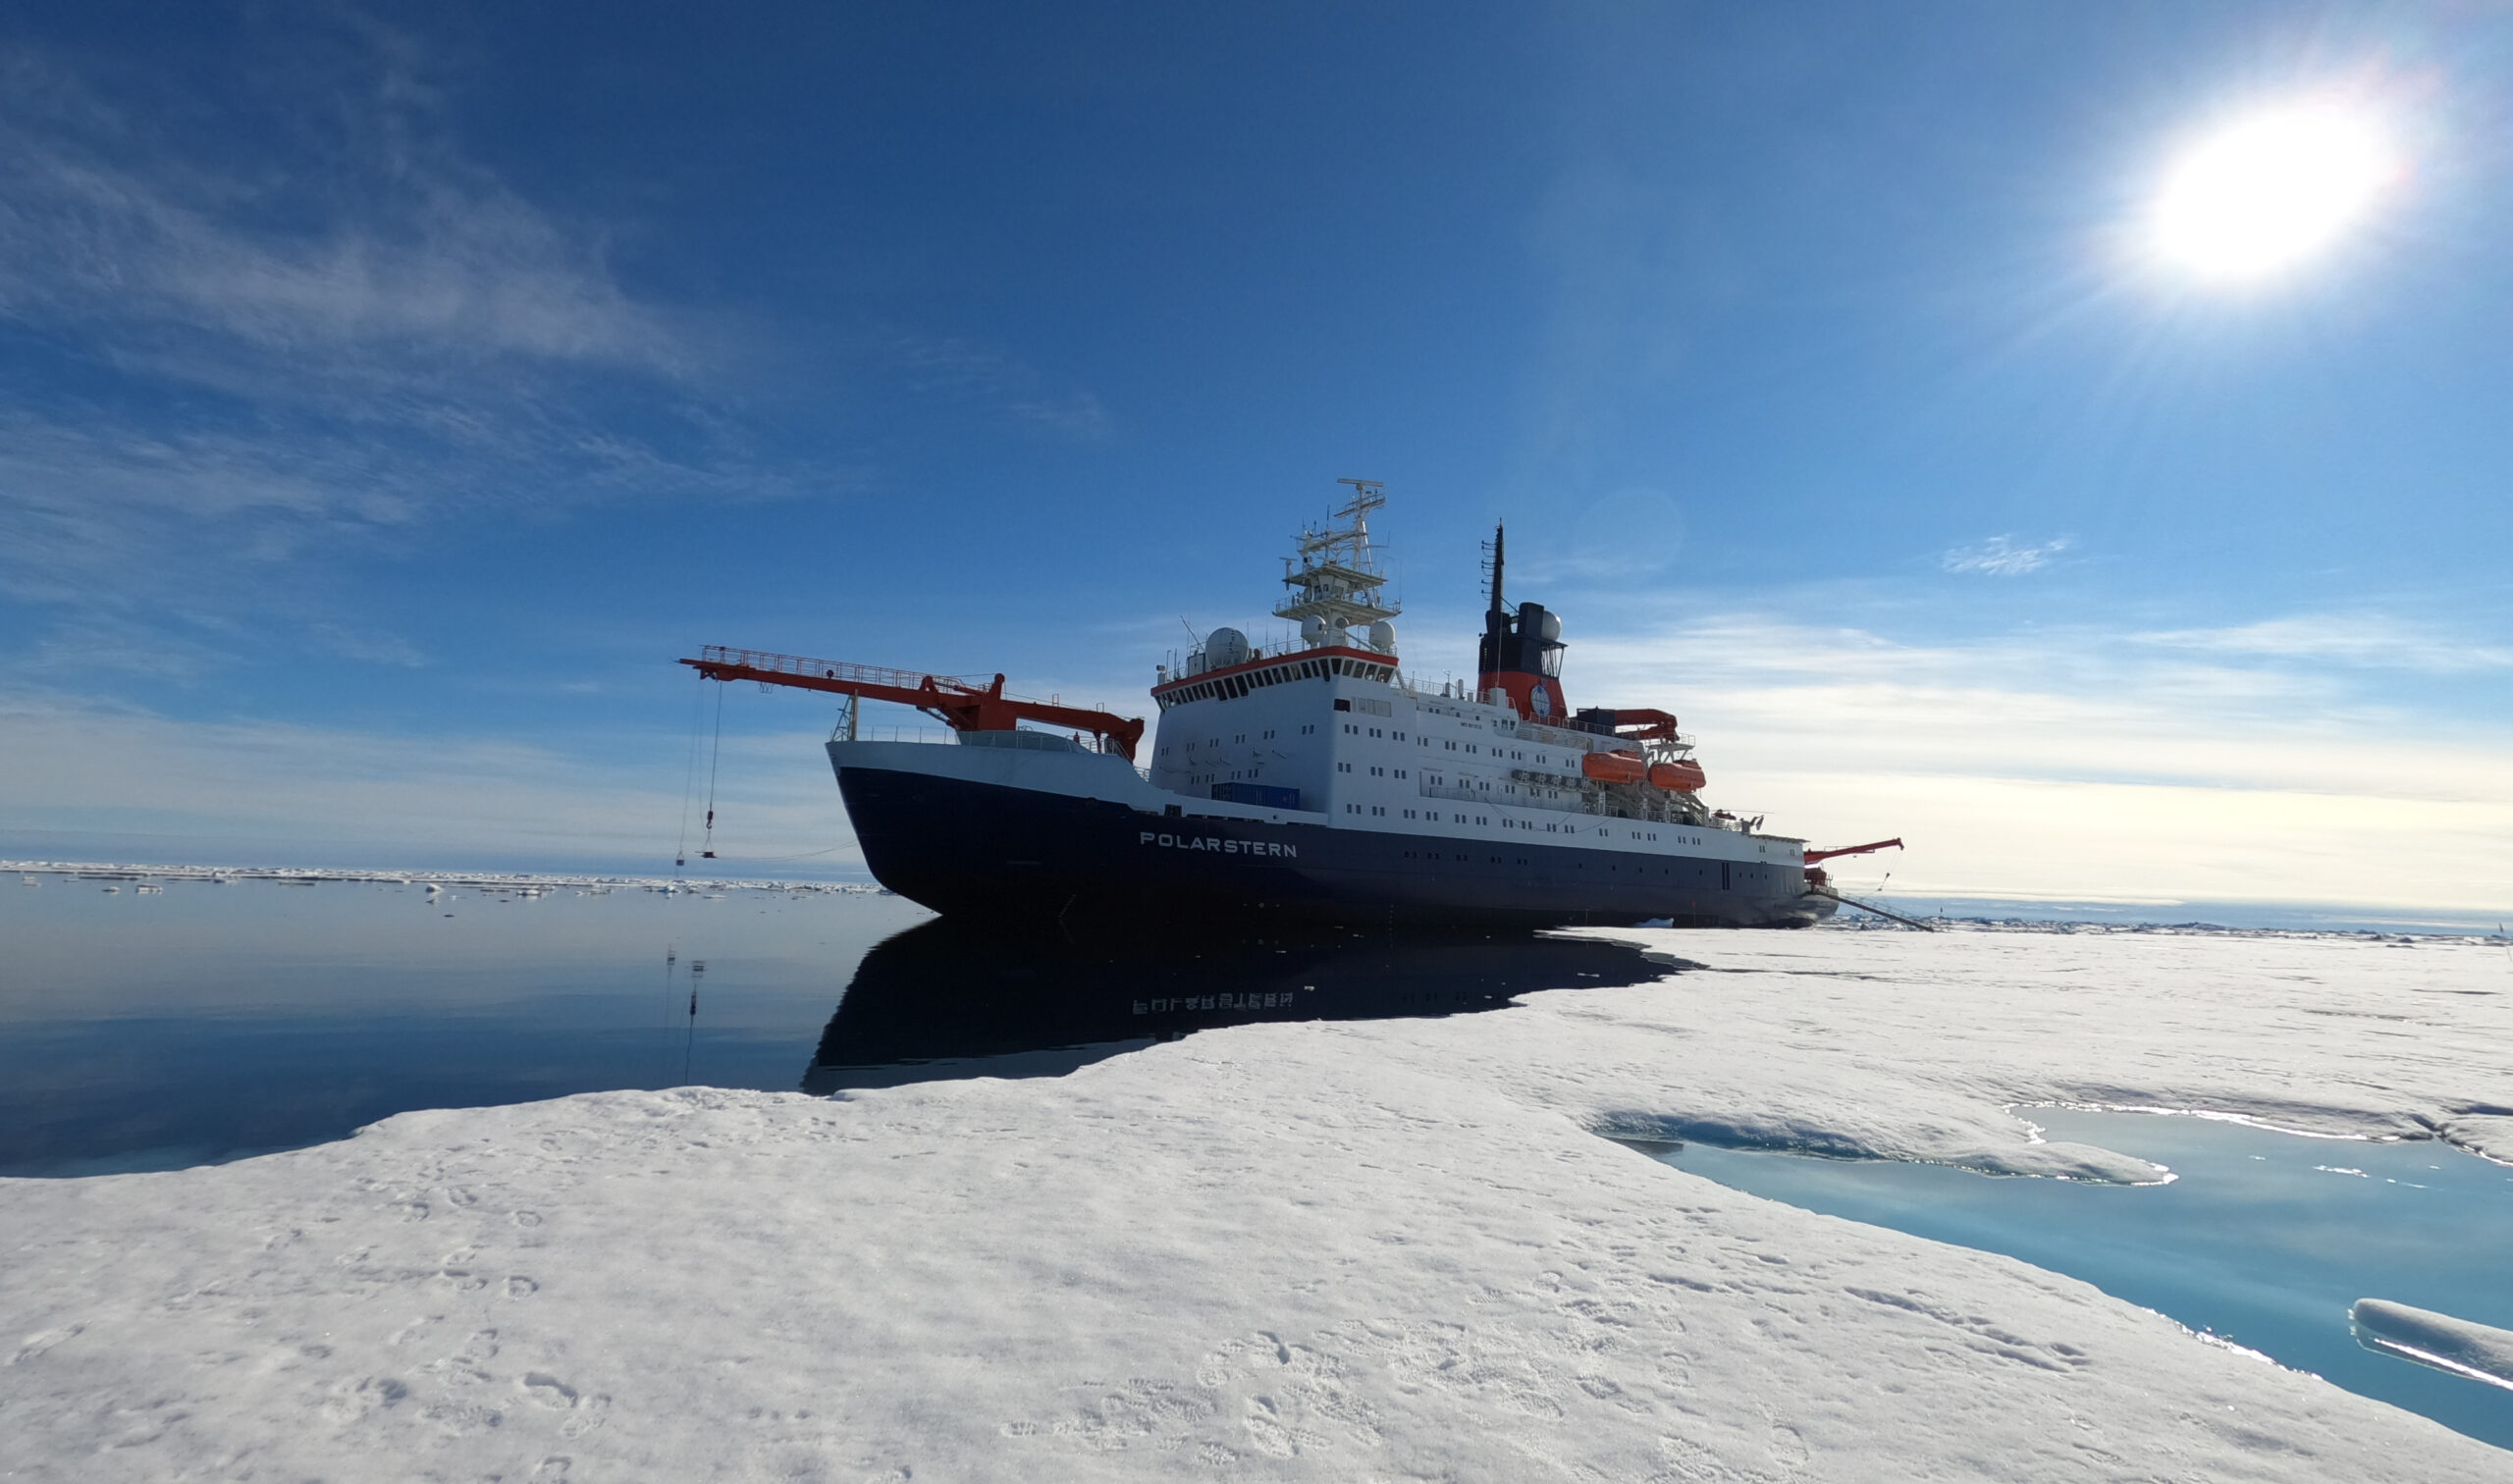
Atmospheric overview of a warm air intrusion event showing the time series of IWV (LWP) from HATPRO as blue (black) line, IWV computed from radiosonde humidity measurements as orange circles (a), absolute humidity profiles from radiosondes (b) and HATPRO (c), as well as temperature profiles from radiosondes (d) and HATPRO (zenith and boundary layer scans) (e).Sea ice conditions close to Aurora Vent Field. Janna Rückert (University of Bremen) and Andreas Walbröl (University of Cologne) adjust the mirror angles for sea ice emissivity scans.Starting sea ice work on the fast ice close to the east coast of Greenland.Radiosonde launched by Andreas Walbröl.Entrance of Scoresby Sund (Greenland) with some ice bergs.Janna Rückert launches the radiosonde on Research Vessel (RV) Polarstern at the entrance of Scoresby Sund while RV Maria S. Merian was in the background.Mountains and ice bergs of the fjord Scoresby Sund.Polarstern as seen from the ice during ice station work.Sampling of sea ice cores to obtain temperature, density and salinity profiles during an ice station.Same as P7136352_by_Janna_Rueckert.JPG, but with sunglasses.