COMPEX-EC in the field is over, and it was a full success. Two weeks in Kiruna with the beautiful Polar 5 research aircraft, equipped with a pretty cool suite of instruments, and all that run by an amazing crowd, was such a good time. Wow! Wow! Wow!
We had seven research flights focusing on under-flying EarthCARE, summing up to more than 30 flight hours. Weather conditions were flyable almost all the time. We could investigate a few cold air outbreaks in the mature state, which was fascinating to see from above and in the instruments. Pretty sure the data collected will serve well for the validation study in the upcoming months. Look out for results on well-known conferences and workshops.
And with that, I’d like to say goodbye and thank you very much for following us.
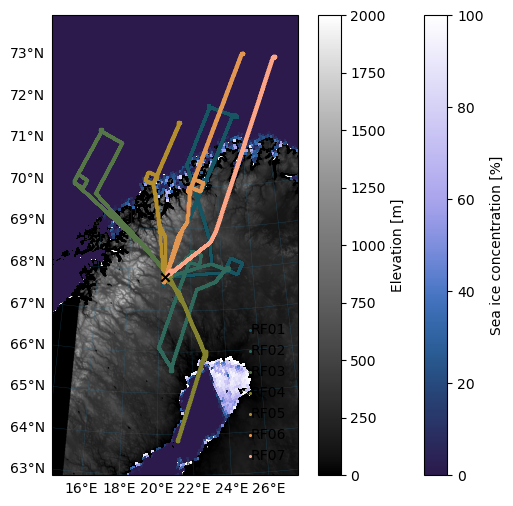
The well-designed COMPEX-EC logo (credits to Friedhelm Jansen (MPI Hamburg)) and all 7 research flights of COMPEX-EC over a digital terrain model and the mean sea ice conditions during the campaign (University of Bremen).
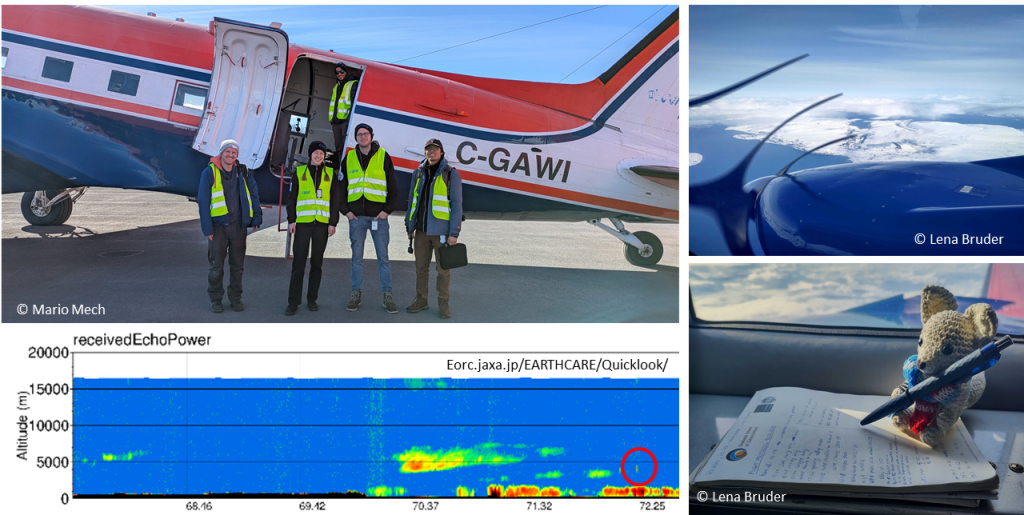
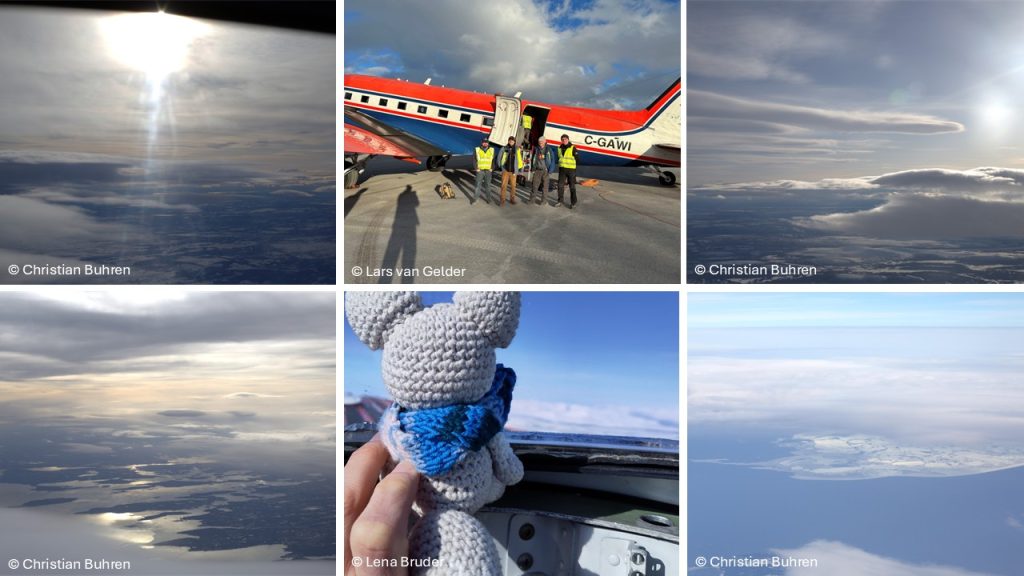
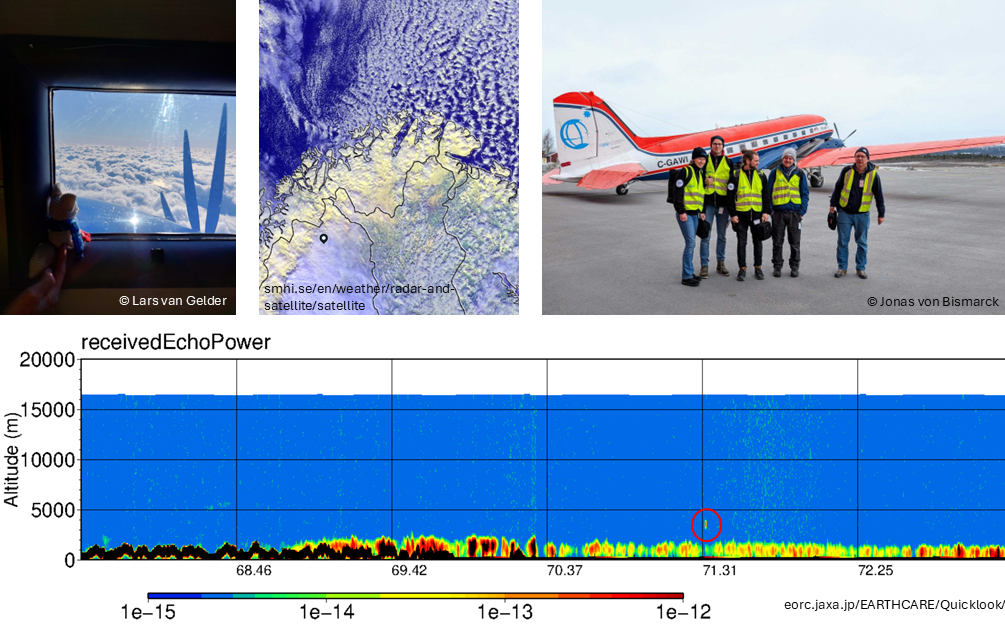
Today we took off for the 7th and last time with Polar 5. With a newly mixed crew, all PhDs were able to fly again, one of them even made her debut as PI. Mika actively supported her and helped, for example, to write the flight log. As a PI, of course, you also have other tasks. The day before, the flight route has to be planned and a flight plan has to be written and sent out. During the flight, you have to keep an eye on the flight altitude and the times when the planned points are reached. You also communicate with the pilots from time to time and make sure that all measurements are started and finished at the right time. But of course, everyone thinks along and knows what to do with their instruments, so they make it easier for you to complete the PI tasks. The view during the flight was great again – we flew over Porsangerfjord on the north coast of Norway, where we could observe the cloud cover thickening towards the north. On the satellite track we launched 5 dropsondes this time and the satellite flew over us in such a way that Polar 5 can be seen again as a signal in the EarthCARE radar data! Everyone was very happy with this last flight. But Mika was also a little sad because it was the last flight for COMPEX-EC and he had enjoyed flying so much. But the next campaign is sure to come and you can also look forward to a final blog entry in which we look back on the campaign and say goodbye to you!
Yesterday’s flight took us out over the open sea, where we expected to see some beautiful convective clouds towering up to 4 km. That meant we had to climb higher again — this time to about 4.5 km. Just before takeoff, we checked the latest satellite images and saw that we’d be flying right into a cold air outbreak (CAO) combined with a small low-pressure system moving eastward towards the Barents Sea. Such weather conditions are always fascinating to fly in, as you can expect an interesting mix of clouds and clear sky. In a CAO, cold air is advected over the relatively warm ocean, leading to a strong temperature difference between the sea surface and the higher layers of the troposphere. This causes the atmosphere near the ground to become unstable – the air can rise, cool down – and condensation occurs: clouds form that can tower up impressively. These promising prospects were, of course, particularly exciting for Mika. During the flight, he carefully monitored the dropsondes – and even threw one or two of them out of the plane himself (but only once they were ready for measurement, of course!). And when there was nothing to do, he was busy taking photos of the beautiful clouds that we were able to admire during our flight. Thanks to Mika, we were able to drop a total of 9 dropsondes, the highest number ever during our campaign! This flight was truly special, as our PI of this flight, Marcus, had his 40th birthday! After landing back in Kiruna, our ground team surprised him with a chocolate birthday cake. Naturally, we gathered the whole crew for a birthday photo. Not only did we have a successful flight with lots of stunning clouds along our track, but we also had a special birthday celebration for our PI. Happy 40th birthday, Marcus!
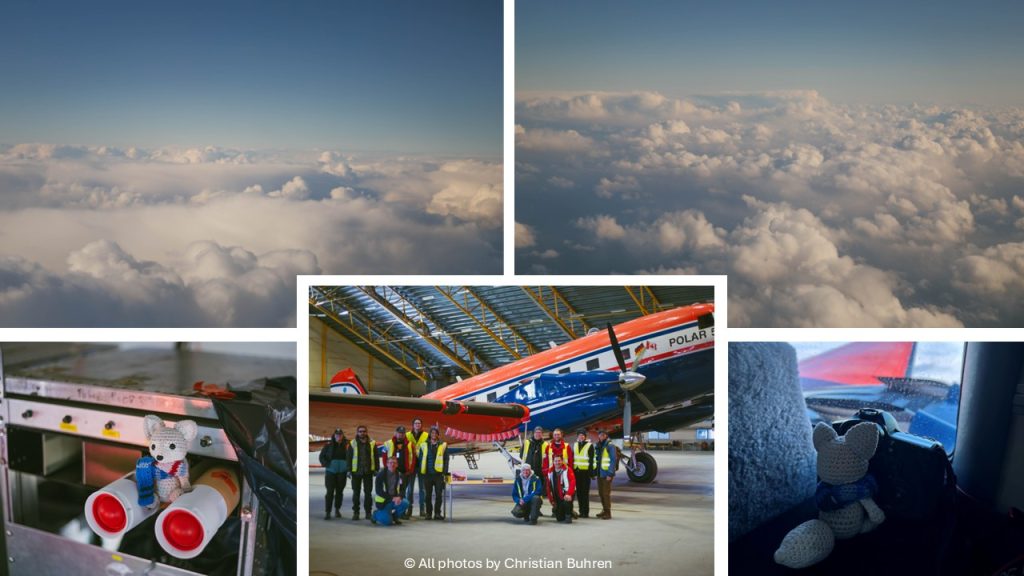
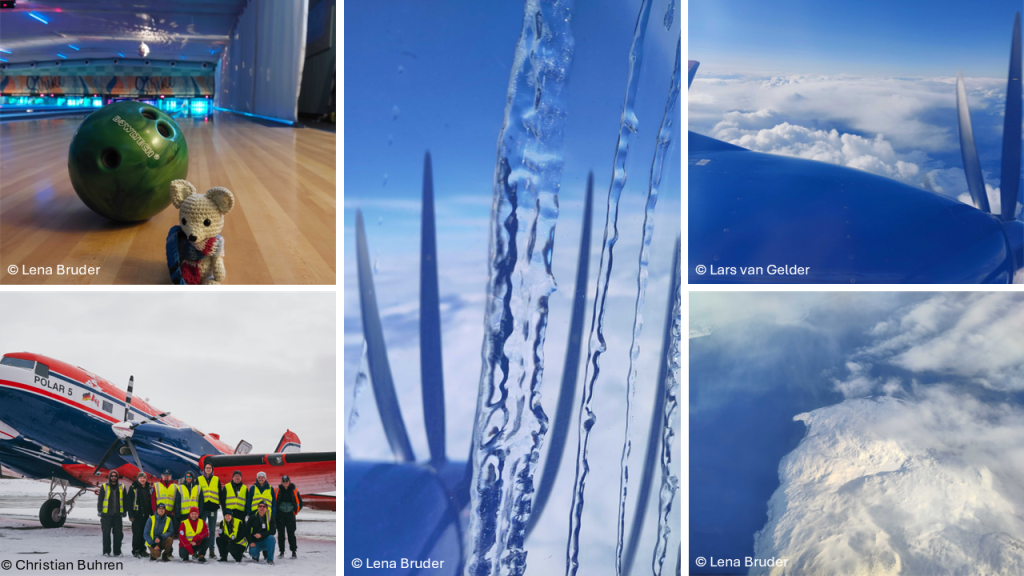
After two days without a flight, today we could finally take off again. The conditions could have been a little better, but that didn’t stop us from flying to continue our research. The forecast was clear – higher clouds than on the first flights, which is why we needed to go up to over 5 km. But before we got on the plane, the group photo of the entire COMPEX-EC crew was on the agenda. A perfect photo on the first try, and we were ready to board the plane. The EarthCARE track north of Kiruna over the Norwegian Sea was well suited for the day and the planning focused on flying on the track against and with the satellite flight direction. In addition, dropsondes on a regular grid were launched to provide more precise vertical profiles on the way there and back. Said, done! The flight went very well with 6 dropsondes and the EarthCARE underflight. We were also able to observe interesting clouds again, including the typical cellular convection pattern of a cold-air outbreak and some showers. As Polar 5 had to stand outside during the nights, frozen water persisted on the windows, but did not stop us from taking pictures of the cloud formations. After the successful completion of also this research flight, the fifth successful one by the way, the team enjoyed an evening together in the bowling center. The pins were hit just as well as we matched EarthCARE satellite with our flights – Doublestrike! Mika also took part, but clearly had a hard time with the big bowling balls. Stay tuned, because the campaign is not over yet!
On Tuesday, we flew towards the Bothnian Sea – an exciting flight, especially because we could see sea ice from the aircraft! This time, we flew relatively high and reached an altitude of 5200 m – the highest altitude we have flown so far during this campaign. The reason for this? The clouds reached 5000 m, and we aimed to fly above them so our instruments could better detect them. Fortunately, the clouds broke up just enough to give us a breathtaking view of the Bothnian Sea. As you can imagine, Mika was thrilled and immediately climbed into the glass dome of Polar 5 to enjoy the 360° view. But safety first – we had to secure him there, otherwise, he might have jumped around in excitement after discovering the sea ice. It was really impressive to see the Bothnian Sea from above, with Finland on one side and Sweden on the other. On the way back, we got to see another treat: Lenticularis clouds, which form when moist air flows over mountains and is pushed to higher altitudes in wave-like patterns. As the air rises in these waves and cools down as a result, clouds form on the ridges, which are smooth and lenticular. Overall, we had a very nice flight! Our next day will be different, as we will visit a special place here in Kiruna, so stay tuned!
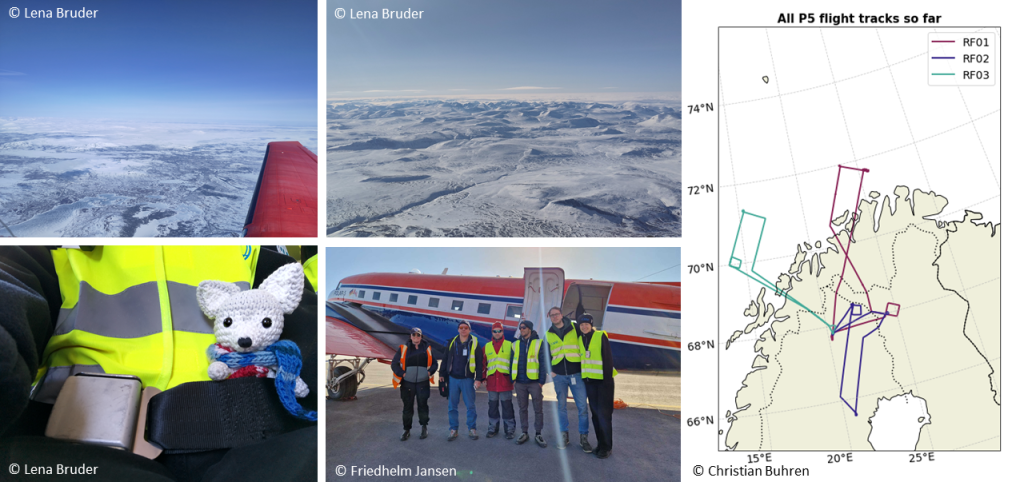
Hej, it’s great that you’re still following us! Totally worth it, because Polar 5 started its next research flight with our crew today at shortly after 12 UTC. Mika was of course very excited again and was the first to fasten his seat belt because he could hardly wait to take off again. Today’s track took us northwest over the Lofoten Islands to underfly EarthCARE over the sea. By the way, on the map you can see today’s flight track as well as those of the first two flights. Cool, isn’t it? The western straight sections from north to south are always the sections where we underfly EarthCARE. The small squares are so-called radiation squares, which are used to calibrate the radiation measuring device “albedometer” in conditions without clouds above the aircraft. We are slowly settling into a routine for operating the instruments and the procedures, but what you can see from the plane is of course still breathtaking! The view from the small glass dome on the ceiling of the plane was particularly beautiful today. The conditions were great. At first we had clear skies and were able to enjoy the view of the winter wonderland snow-covered mountains until we reached a large cloud cover, above which we then had great measuring conditions for our campaign.
Tomorrow will be the fourth flight, this time towards the Bothnian Sea, which is still partly covered in sea ice. We’re sure it will be great. So, stay tuned 🙂
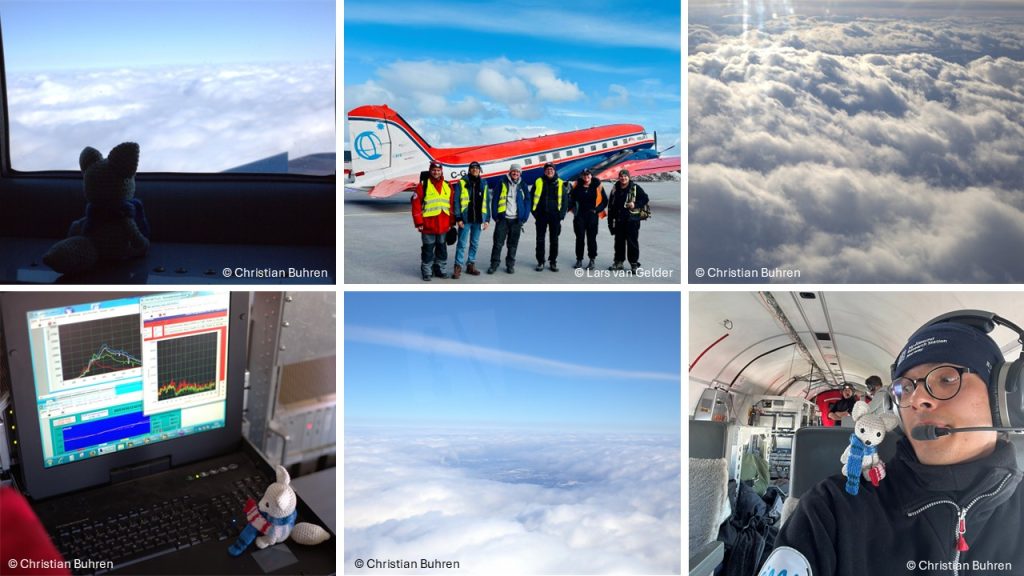
Our second flight took us south of Kiruna over land before heading towards Pallas, where a Cloudnet station is located.This is great as we can compare the measurements from the Cloudnet station with our airborne measurements, which is good for validation. Science can be so nice! Although we were not entirely sure if we would find many clouds along our flight path before takeoff, we actually had a very interesting case with lots of clouds and also clear sky conditions. The EarthCARE match took place when there were only a few clouds and some snow on the surface, which is very interesting for the validation. So we managed to fly the EarthCARE track right during a nice transition from cloudy to clear sky conditions. This time Mika was very interested in what the spectrometers measured during our flight. Feeling a little tired, Mika made himself comfortable on Christian’s shoulder, curious about what he was doing—or maybe just wanting a better view out the window. All in all, it was a pleasant flight with some lovely clouds and beautiful views out the window!
Next up: tomorrow’s flight towards the Norwegian coast—low-level cloud conditions are looking promising again, so stay tuned!
Yesterday, some of us took our first flight with Polar 5. The prospects were great because, according to the satellite image, our planned flight track would even lead through a cold air outbreak! So, the anticipation was already high. After some preparations in the hangar and a safety briefing from the pilot, Kyle, the crew could settle into the aircraft. Luggage was stowed, devices switched on, seatbelts fastened, and at 11:03 UTC, we were ready for takeoff. On our way north to turn over the Norwegian/Barents Sea onto the track of the EarthCare satellite, we flew over beautiful snowy landscapes and low clouds. After Mika was quite nervous during takeoff, he didn’t want to leave the window; he was so impressed by the view! After most of the measurements had already been initiated at the beginning of the flight, we also started the lidar measurements over the sea. We also launched several dropsondes along the satellite’s path, which record vertical wind, humidity, and temperature profiles on their way to the ground. Now, we were flying on the trajectory that the satellite would cross during this period, and our underflight was successful: The satellite flew directly overhead. It’s a match! This is also indicated by the dot in the satellite’s radar measurements, which represents our aircraft. We landed shortly after 16 UTC with good measurements and some great impressions. The next flight will take place on Sunday. Stay tuned!
In the Atacama Project second phase (2021 to 2024), the A1 group focused on moisture variability and transport into the Namib and Atacama. A comparison between these two deserts allows us to understand the role of the topography in the marked observed differences in moisture, cloud, and rainfall. As the current Namib´s topography resembles the Atacama Desert before the uplift of the Andes, this study also allowed us to understand the slow aridification process that led to extended hyperaridity in the Atacama.
For this purpose, we produced a climatological comparison of water vapor interannual variability and seasonal cycle, including the role of clouds, using state-of-the-art reanalysis ERA5 validated with surface observations.
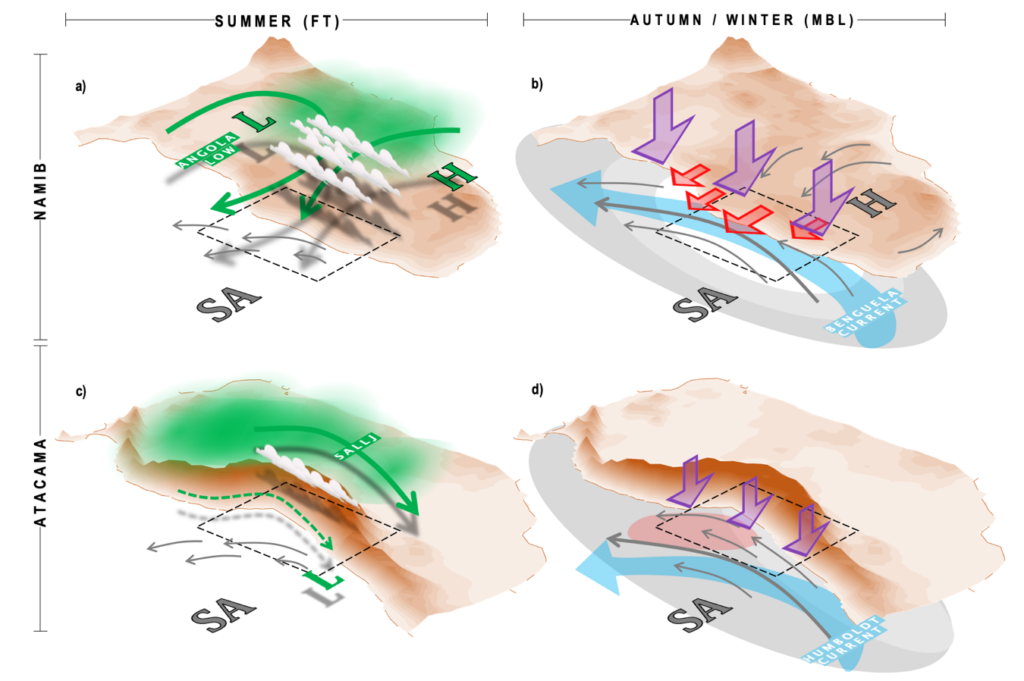
We found several differences in the atmospheric circulation triggered by the difference in topography. For example, between January and July, the circulation over southern Africa leads to persistent airmass transport from the continent’s interior to the coast. This produces two significant effects: in summer, the easterly winds increase moisture in the free-troposphere, accompanied by clouds and rainfall (Fig. 1a). In autumn and winter, the easterlies are shallower, disrupting the coastal marine boundary layer (MBL), reducing the low clouds near Namib´s coast and inducing frequent clear-sky conditions (Fig. 1b).
Figure 1. Schematic figure of the main features associated with changes in water vapor and clouds for summer (DJF) in the free-troposphere (a,c) and autumn (MAM) and winter (JJA) for the boundary layer (b,d). In the left panels: the circulation pattern at 850–750 hPa in green arrows. Green thick and thin-dashed arrows represent strong and weak water vapor transport, respectively. We included the position of the main low (L) and high (H) pressure systems, as well as the South American Low-Level Jet (SALLJ). In the right panels, boundary layer winds are plotted with gray arrows. The stratocumulus cover is represented with gray shades, with darker tones indicating more clouds and white less clouds. The Benguela and Humboldt currents are shown by clear blue arrows and warmer SSTs in clear red. Warmer air in the upper MBL/lower FT is represented by red arrows and the subsidence intensity in purple arrow. We included the position of the Subtropical Anticyclones (SA) and the continental high-pressure systems (H) [Vicencio et al., 2023]
In the Atacama, the Andes block almost any exchange of air mass between the Pacific Ocean and the continent’s interior. In summer, moisture from the Amazonas is directed southeast of the Andes, leading to a drier free-troposphere in the Atacama compared to the Namib (Fig. 1c). The absence of the easterlies on the Atacama’s coast maintains year-round a well-developed MBL, with a higher proportion of low clouds than Namib despite the weaker low-level stability and warmer SST (Fig. 1d).
The impact of topography on rainfall can also be interpreted by comparing both desert’s current climates. The most rainfall in Namib is observed between summer and autumn due to the effect of the easterly winds. The Atacama lacks this feature, reducing the wet period only to winter. Therefore, it is highly likely that the Atacama observed a similar rainfall pattern as in the Namib nowadays before the uplift of the Andes around 20 Million years ago. Continued uplift of the cordillera likely intensified the aridification of the desert’s interior by blocking moisture transport from the interior of South America, leading to the extreme drier conditions observed nowadays on the coast and central depression, where the annual rainfall rates ranges barely between 0.25 and 5 mm.
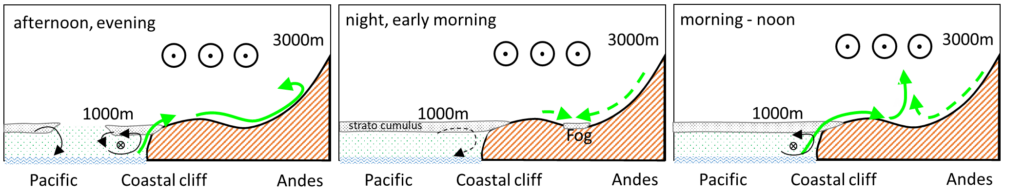
Despite the extreme hyperaridity in the Atacama, moisture finds its way to the core of the desert. Using surface-based weather stations and Large Eddy simulations with the ICON-LEM model for a typical winter day, we found that moisture from the MBL crosses the coastal mountains through certain valleys (Fig. 2). Most of this transport occurs in the afternoon-evening and reaches the slopes of the Andes but not further. This moist air remains in valleys and basins during the night, where nighttime cooling eventually leads to fog formation. At the onset of the circulation in the morning and noon hours, convergence at the surface leads to the injection of moist air in the atmosphere above the surface boundary layer. From here, it is transported further south by the mid-troposphere circulation. Reanalysis data suggest that this feature is relatively common in austral winter.
Figure 2: Schematic of the diurnal circulation. Green arrows indicate water vapor transport from the maritime boundary layer into the desert. The weaker nighttime downslope flow is marked with dashed lines. Circles with dots at 3km height indicate a northerly, moist flow transporting moisture to the south. [Figure created by Dr. Jan Schween and modified from Schween et. al 2020]
Additionally, we found that moisture also finds its way in summer. This time, thanks to a weak but climatological moisture transport structure (Fig. 1c) in the lower free troposphere offshore southern Perú and northern Chile, bringing the humidity from the tropical eastern Pacific to the desert. We named this mechanism as moist northerlies (Vicencio et al., in review). Once the humidity reaches the Atacama´s coast, it is transported inland by the Rutllant cell. This pattern sometimes leads to extreme precipitation events across the Atacama and precordillera. In recent decades, the number of summer rainfall episodes linked with this mechanism has increased, reaching a peak in 2020.
The key mechanism for this moisture intrusion into the desert is the southward shift of the subtropical anticyclone, which is associated with the expansion of the Hadley cell due to human-induced greenhouse gas emissions. Therefore, it is highly likely to continue observing similar rainfall events in the next decades over the Atacama, increasing moisture availability via transport, rainfall and clouds.
Note: This post was originally written and edited by Jose Vicencio and Jan Schween for the Atacama Project Website.