A couple of days ago, we had the first ice station, where we measured the ice properties in the area covered by the radiometers. This means we looked at vertical profiles of temperature, salinity, and density in an ice core, surface roughness, the microstructure of snow and ice, and ice thickness, while one of us took over the watch for polar bears.
By now, we have also gotten used to staying up late (or waking up in the night) to launch a radiosonde at midnight which collects temperature, pressure, humidity and wind profiles until a height of about 35 kilometers. (Nils is currently leading our internal scoreboard with a radiosonde height of 35.4 km.)
The last couple of days were very foggy, but we could see higher clouds below zero degrees which look very promising for mixed phase hydrometeors!
Hello from the RV Polarstern! We left Tromsø last Friday for the journey to the Central Arctic Ocean for the VAMPIRE campaign (Water VApor, Mixed-Phase Clouds, and Sea Ice Emissivity over the Central ARctic OcEan)! With the help of Mario and Pavel for the first days, have now set up our wide range of instruments: the radars GraWAC and MiRAC-A, radiometers HATPRO and LHUMPRO, a disdrometer, an ultrasonic, an infrared camera, a sky camera, and a GoPro on the upper decks of the ship where we have a really nice view, and have started measuring.
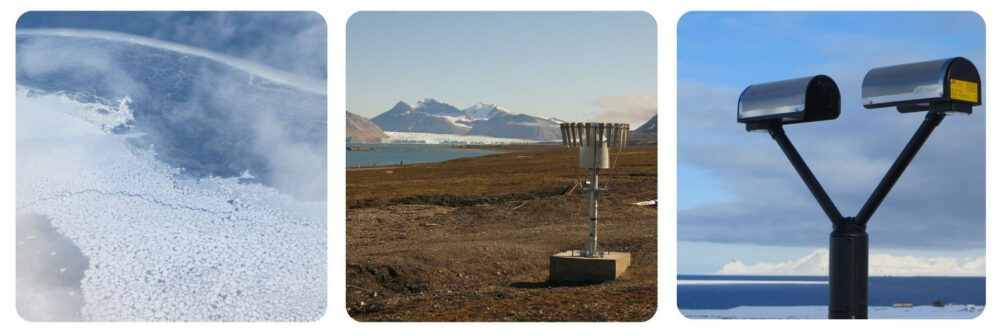
From left to right: ultrasonic, disdrometer, W-band radar, G-band radar ((c) J. Rückert)The two radiometers (HATPRO and MiRAC-P) on the A-deck ((c) L. Bühler)
Yesterday, we reached the first sea ice! A first ice station is planned for tomorrow or the day after, so look out for updates (just as we’ll be looking out for more polar bears).
As we reported earlier in this blog, we participated in the airborne field campaign HALO-(AC)³ In March and April 2022. The goal of the campaign was to improve the understanding of the airmasses transformation when transported into or out of the Arctic. Two types of airmass transports were of particular interest: First, moist and warm air intrusions that transport high amounts of heat and moisture from the mid-latitudes into the Arctic. Second, marine cold air outbreaks that lead to the formation of cloud streets and convective cells when cold and dry air from the central Arctic is transported southwards over the relatively warm North Atlantic. In our study, we analyse the weather (and sea ice) conditions during the HALO-(AC)³ campaign.
Map of the study area of the HALO-(AC)³ campaign including the flight tracks of the research aircraft HALO, Polar 5 (P5) and Polar 6 (P6). The study area has been separated into three subregions.
We separated the campaign into a warm and a cold period with the help of northwards humidity transport (IVT) and the so-called cold air outbreak index (MCAO index). The cold air outbreak indicates the strength of the temperature difference between the surface and the lower atmosphere. High differences suggest cold air outbreak conditions with strong interactions between the cold ocean and the atmosphere. The warm period was dominated by northward winds and warm air intrusions while the cold period featured several cold air outbreaks.
(a) Northward water vapour transport (IVTnorth) and (b) marine cold air outbreak (MCAO) index for the campaign duration in 2022 (black line). Grey shading indicates the climatology over the years 1979-2022. The red box shows the warm period, while the blue box illustrates the cold period.
During an extremely strong warm air intrusion, record breaking near-surface temperatures occurred in the central Arctic compared to the March 1979-2022 climatology. Also at Ny-Ålesund, the weather station recorded the highest near-surface temperatures for March since the beginning of the measurements in 1975. This warm air intrusion was detected as so-called Atmospheric River, a thin but long band of extremely strong moisture transport. Over the sea ice northwest of Svalbard, record breaking rainfall rates occurred.
Average 2 m temperature in March 2022 north of 80°N (red line). Thin black lines show the temperature for each year between 1979 and 2022 and the thick black line illustrates the average over those years.
At the beginning of the cold period, a strong cold air outbreak led to an extremely dry atmosphere over Ny-Ålesund with integrated water vapour content of just 1.1 kg m-2 (24 March 2022). Less than 3 % of all radiosondes launched since 1993 recorded drier conditions.
Humidity measurements from radiosondes (weather balloons) launched at Ny-Ålesund (Svalbard) during HALO-(AC)³. The colours indicate the specific humidity (fraction of water vapour mass to total air mass) while the black line shows the total humidity content of the troposphere (lowest layer of the atmosphere).
During the cold period, we also observed the Arctic version of a hurricane, a Polar Low. Polar Lows are characterised by convective (cumulus) clouds, relatively strong winds (at least gale force) and precipitation, while extending only over a few 100 kilometers. They also have a relatively cloud free centre like the eye of a hurricane. We analysed the environmental conditions for the formation of the Polar Low.
Photo taken from the research aircraft HALO during the flight to observe the Polar Low.
Luckily, the weather conditions were quite favourable to achieve the goals of the campaign because we could capture both types of airmass exchange between mid-latitudes and the Arctic. The publication has been submitted to the European Geosciences Union journal Atmospheric Chemistry and Physics.
The Transregional Collaborative Research Centre TR 172 (AC)³ and the University of Helsinki organized a joint winter school on Arctic amplification at the Hyytiälä Forestry Field Station in Finland. The field station is located about 200 km north of Helsinki in a boreal forest. This remote place served as the perfect place to learn about state-of-the-art observations of the atmosphere and biosphere.
Our daily program consisted of lectures in the morning by scientists from Europe and the U.S. and a combination of group work and field excursions in the afternoon. The lectures covered all research topics of (AC)³: surface energy budget over sea ice and open ocean, cloud microphysics, aerosols, ocean and atmosphere remote sensing, climate feedback mechanisms, Arctic water cycle, atmospheric rivers, and polar-midlatitude linkages. A highlight was an excursion to the meteorological towers that observe for example the formation of new aerosol particles and the deposition of CO₂ by the forest (see photos below).
Group photo in front of the old dining hall. (Photo: Christa Genz)94 GHz cloud radar (left) and microwave radiometer (right) observing clouds, precipitation, and thermodynamic profiles above the boreal forest. (Photo: Christa Genz)The 127 m high tower SMEAR II.A sonic anemometer above the canopy.
This week Mario and myself traveled to Ny-Ålesund, Svalbard, to exchange our cloud radar MiRAC-A with the cloud radar JOYRAD94. Since MiRAC-A is needed for campaign preparations, it has to travel back to Germany. Swapping the instruments on the roof of the atmospheric observatory of AWIPEV (https://www.awipev.eu/) went very smoothly.
Crane operation to lift the cloud radar JOYRAD94 on top of the AWIPEV atmospheric observatory
Thanks also to the AWIPEV and Kingsbay support! What a wonderful place to do measurements!
In December, Kerstin was interviewed by a journalist in the local newspaper “Kölnische Rundschau”. The article (in German) about climate change in the Arctic and about our measurement activities in the Arctic, in particular at AWIPEV (Ny-Ålesund, Svalbard), was published on Dec 27, 2022.
What is it about?
The article highlights the importance of long-term data and data analysis for climate studies. It is always great to have the chance to communicate our science to the broader public! And of course it is a challenge as well…
Polarstern cruise PS131 (ATWAICE) was a multidisciplinary expedition to investigate sea ice melting processes in the warming Arctic, ocean currents affecting nutrient supply for flora and fauna, ocean impacts on the melt of glaciers at Greenland’s east coast, and to deploy seismometers at the Aurora Vent Field. The expedition started on 28th June 2022 in Bremerhaven and led us to the Fram Strait, the marginal sea ice zone north-west of Svalbard, to fast ice at the east coast of Greenland and to Scoresby Sund, before returning to Bremerhaven on 17th August 2022.
Our working group also joined the expedition with atmospheric measurements using microwave radiometers (HATPRO and MiRAC-P) and radiosondes (weather balloons). The microwave radiometers faced the sky and primarily measured radiation emitted by the atmosphere (oxygen, water vapor, and liquid droplets). An additional sky camera consisting of a GoPro Hero 10 Black and an infrared sensor was mounted next to the radiometers on the guard rail of Polarstern to give us information about the sky conditions. From the HATPRO data, we could already retrieve preliminary temperature and humidity profiles, as well as the total amount of water vapor (known as Integrated Water Vapour or IWV) and cloud liquid water path (LWP) with a high temporal resolution (1 second). Complementary to the radiometers, radiosondes give us high vertical but low temporal resolution of temperature and humidity profiles. An example of this is shown for an extraordinary warm and moist air intrusion event from 15th to 19th July 2022. IWV peaked at 35 kg m-2 (comparable to mid-latitude summer conditions), and the temperatures reached more than 18 °C at a few hundred meters altitude. With a mirror construction designed by Pavel Krobot and Rainer H.-Lind and attached to the radiometers, we could also directly observe the radiation emitted by the sea ice and ocean. These measurements will later be compared to skin temperature measurements of the sea ice taken by an infrared camera to estimate the sea ice emissivity. Another GoPro is also mounted on the infrared camera to provide a visual context of the sea ice conditions.
Atmospheric overview of a warm air intrusion event showing the time series of IWV (LWP) from HATPRO as blue (black) line, IWV computed from radiosonde humidity measurements as orange circles (a), absolute humidity profiles from radiosondes (b) and HATPRO (c), as well as temperature profiles from radiosondes (d) and HATPRO (zenith and boundary layer scans) (e).Sea ice conditions close to Aurora Vent Field. Janna Rückert (University of Bremen) and Andreas Walbröl (University of Cologne) adjust the mirror angles for sea ice emissivity scans.Starting sea ice work on the fast ice close to the east coast of Greenland.Radiosonde launched by Andreas Walbröl.Entrance of Scoresby Sund (Greenland) with some ice bergs.Janna Rückert launches the radiosonde on Research Vessel (RV) Polarstern at the entrance of Scoresby Sund while RV Maria S. Merian was in the background.Mountains and ice bergs of the fjord Scoresby Sund.Polarstern as seen from the ice during ice station work.Sampling of sea ice cores to obtain temperature, density and salinity profiles during an ice station.Same as P7136352_by_Janna_Rueckert.JPG, but with sunglasses.
Far in the North on Svalbard at the AWIPEV research station in Ny-Ålesund, the Institute for Geophysics and Meteorology operates a set of cloud remote sensing instruments in the framework of the (AC)3 DFG program. The idea of setting up instruments that far in the North is to learn more about Arctic clouds, like their structure, lifetime, or the role they play in the dramatic change of Arctic climate. A key instrument of the setup is a cloud radar measuring at 94 GHz. Such a cloud radar shows the vertical structure of Arctic clouds by measuring the reflected signal send upwards in different levels (radar reflectivity).
The intensity of the reflected signal depends thereby on the size, amount, and shape of cloud and precipitation particles (hydrometeors) found in the atmosphere. Easily speaking, the more red the color the thicker the cloud or the more precipitation is present. In addition to the radar reflectivity, the cloud radar can measure the vertical motion of the hydrometeors and by that where up- or downward motion is present or distinct between clouds and precipitation.
During the last three years, JOYRAD94 has done a perfect job in Svalbard. But now it is time for some maintenance at the manufacturer. Therefore it needs to be de-installed, packed and shipped back to Germany. To do that, a team from our institute has traveled to the Arctic for two weeks. Since we definitely do not want to be without cloud radar measurements, our second cloud radar MiRAC-A, usually operated onboard the Polar 5 aircraft, has been shipped up there and will take over JOYRAD94’s job. So today a huge crane took JOYRAD94 from the roof of the AWIPEV observatory building and lifted up MiRAC-A. It can make you quite nervous to see several hundred thousand euros hanging on four ropes. But the crane driver was a genius and it all went smoothly. After a bit of screwing, drilling, fixing, and configuring, MiRAC-A was set up and continued the important job JOYRAD94 did the last years – collecting data on Arctic clouds.
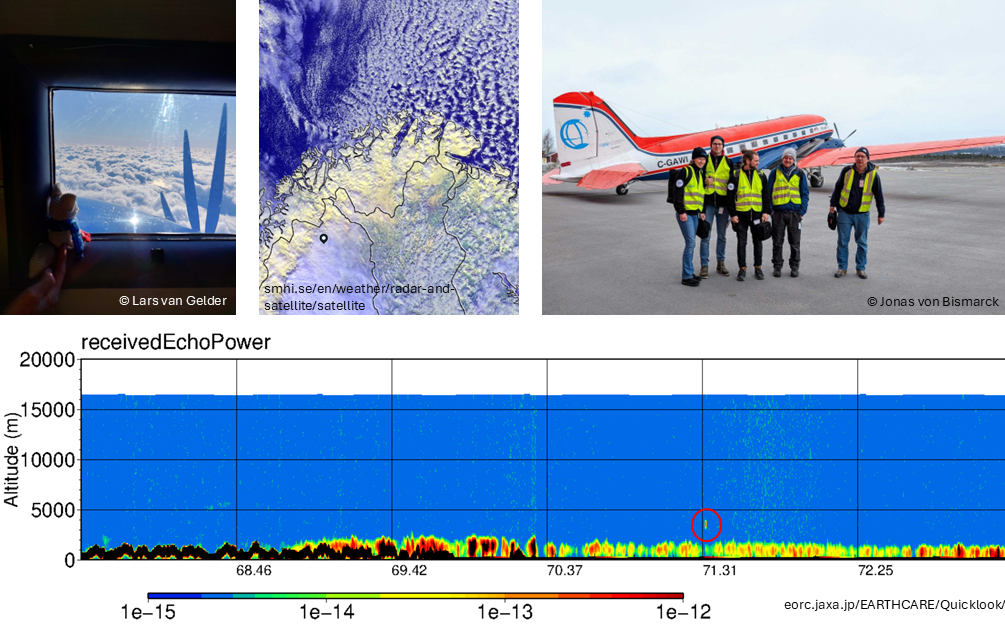
What a successful day! P5, P6 and HALO had their first joint research flight on Sunday!
If you ask yourself “What is HALO? And what is special about a joint flight?” then read on…
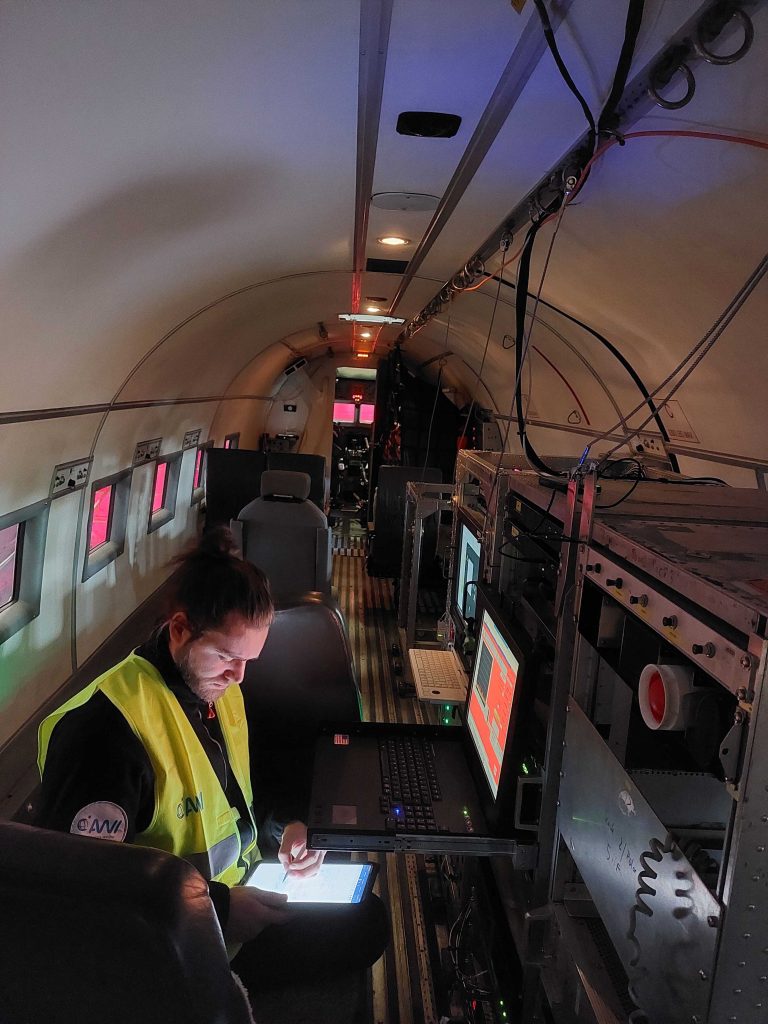
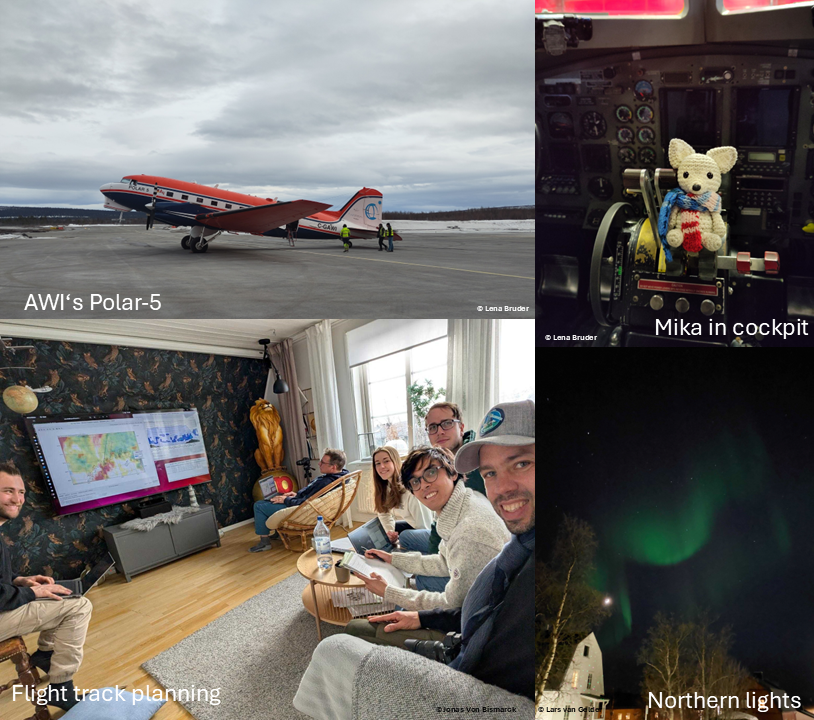
First, let’s start with something you already know from the previous posts: P5 and P6 are polar aircraft, which participate in the HALO-(AC)³ campaign and which are stationed in Longyearbyen, Spitsbergen. The instruments belonging to the University of Cologne, namely the radar MiRAC and the microwave radiometer HATPRO, are installed on P5, which is a remote sensing aircraft. Contrary, P6 is equipped with in-situ instruments recording atmospheric parameters and cloud particles near the aircraft. Thus, P5 is mainly flying above the clouds at an altitude of around 3 km, whereas P6 is flying at lower altitudes directly through the clouds. Joint flight activities of the two polar aircraft provide in-situ and remote sensing observations of a lot of different parameters from the same cloud at the same time!
HALO at the airport in Kiruna, Sweden. (Photo: Henning Dorff)
Next, HALO comes into play. HALO stands for “High Altitude and Long Range Research Aircraft” and is operated by the German Aerospace Center (DLR). HALO carries remote sensing instruments similar to P5, but is able to fly at higher altitudes of about 10 km and travel much longer distances. During HALO-(AC)³ it is stationed in Kiruna, the northernmost city of Sweden, together with other scientists from our group. The aim is to observe how air masses change in the Arctic by measuring the temperature, humidity, cloudiness or aerosol concentration along the wind direction.
As often as possible, joint flights with all three aircraft will be realized, which is really difficult to coordinate! Another difficulty are the bad weather conditions in Longyearbyen making flights with the polar aircraft impossible. And sometimes the different platforms are interested in different clouds or air masses.
During the first joint flight, the flight conditions were very calm! Our instruments worked well and observed precipitating cloud structures over sea ice and open water. In one of the following posts we will have a first look at the observations!
View over broken sea ice from P5.
If you are interested in a video diary with short daily updates on the work routine in Longyearbyen, just follow AWIexpedition on Instagram!